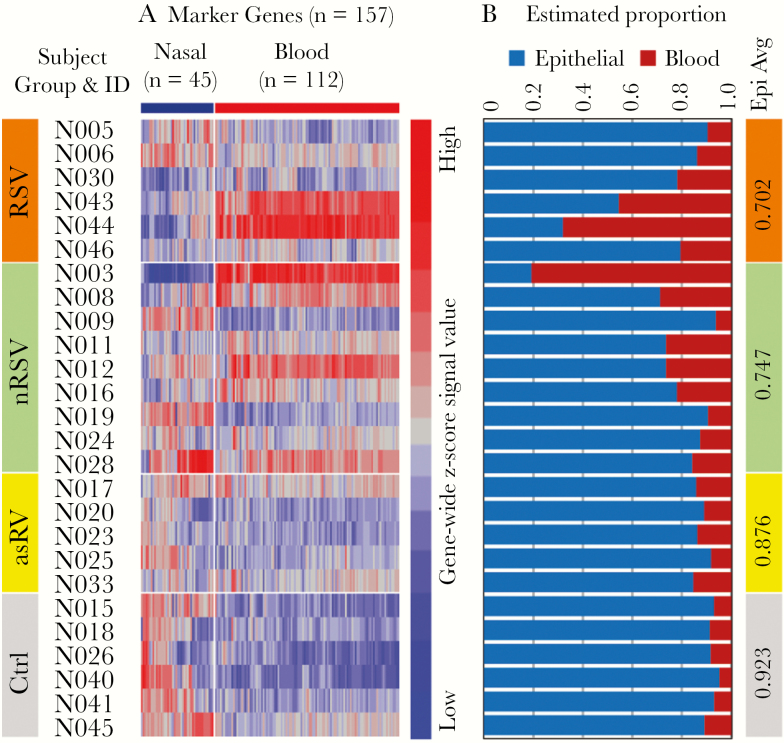
Figure 4.
Cell type-specific signal deconvolution for nasal gene data set. (A) Expression profiles of 157 marker genes in the nasal samples. (B) The digital sorting algorithm-estimated proportion of signal contributed by epithelial and hematopoietic cells for each of the 26 nasal samples. The numbers in the vertical bar on the right are the mean nasal signal proportion for each of the 4 subject groups. asRV, asymptomatic rhinovirus; Ctrl, control; ID, identification; nRSV, nonrespiratory syncytial virus; RSV, respiratory syncytial virus.

