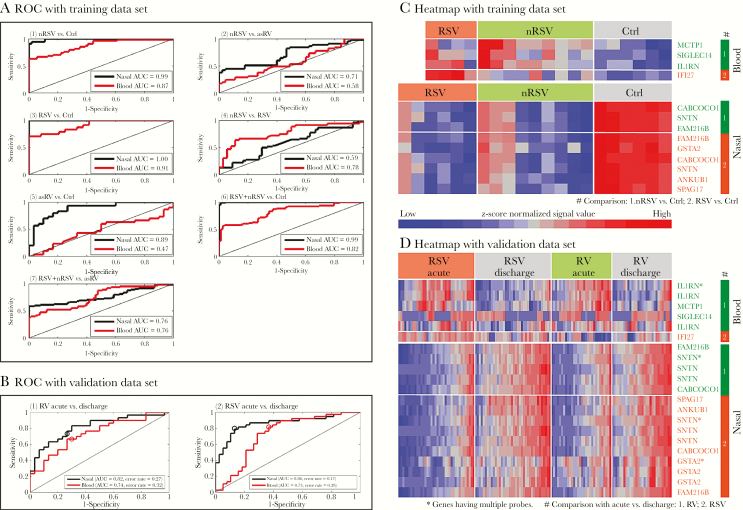
Figure 7.
Nested cross-validated (CV) receiver operating characteristic (ROC) curves with area under the curve (AUC) for the discriminatory genes based on a modified supervised principal components analysis. A shows ROC curves with corresponding AUCs for gene-based classification scores comprising nasal and blood genes. (1) Nonrespiratory syncytial virus (nRSV) vs control (Ctrl), (2) nRSV vs asymptomatic rhinovirus (asRV), (3) respiratory syncytial virus (RSV) vs Ctrl, (4) nRSV vs RSV, (5) asRV vs Ctrl, (6) RSV + nRSV vs Ctrl, (7) RSV + nRSV vs asRV. B shows ROC curves with corresponding unstratified AUCs and error rates for gene-based classification scores using nasal and blood genes from the present study applied to classify samples from an external dataset (Do et al [33]). (1) RV acute vs discharge, (2) RSV acute vs discharge. Open circles indicate the gene-based classifiers defined by thresholding the mean of 0, yielding the reported error rates. C and D show heat maps displaying the expression of genes used to create the gene-based classification scores the ROC curves displayed in A and B.

