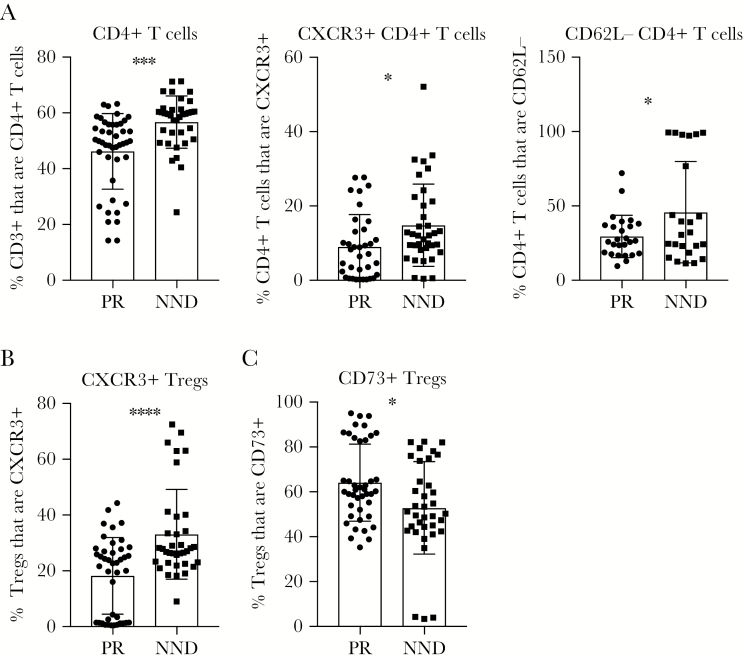
Figure 3.
Peripheral T-cell responses linked to West Nile virus (WNV) restriction from the central nervous system. F1 crosses of Collaborative Cross strains were grouped into peripheral restriction (PR) and neuroinvasion, no disease (NND) categories as defined in “Results” and Table 1. Cohorts of mice were infected with 100 plaque-forming units of WNV by subcutaneous injection in the rear footpad. On day 7 after infection, age-matched male mice were euthanized, and spleens were harvested and prepared for flow cytometry staining to determine the frequency of CD3+ cells that are CD4+ T cells, the frequency of CD4+ T cells expressing CXCR3 or not expressing CD62L (A), the frequency of regulatory T cells (Tregs) not expressing CXCR3 (B), or the frequency of Tregs expressing CD73 (C). Statistical significance was determined by the unpaired t test. *P ≤ .05, **P ≤ .01, ***P ≤ .001, and ****P ≤ .0001.

