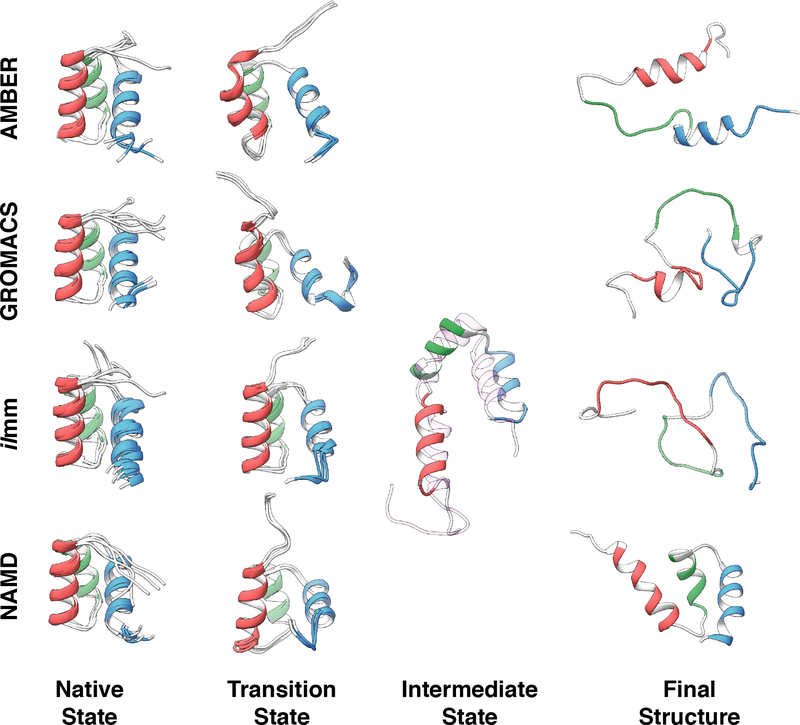
Figure 10. Survey of conformations populated during high temperature unfolding of EnHD.
Native state: Five snapshots, extracted from simulation one of the 298 K simulations at 0 ns, 50 ns, 100 ns, 150 ns, and 200 ns, serve as a visual reference of native state sampling. Transition state: For each of the four MD packages, the transition state is represented by three overlaid structures extracted from the simulation that best modeled the experimentally determined transition state. Intermediate state: One intermediate state structure was extracted from the ilmm simulation that best modeled the experimentally determined intermediate state. Model 1 of the experimentally determined intermediate state structure is shown as a transparent ribbon and aligned against the MD-derived intermediate structure. Final structure: To represent the extent of unfolding that occurred during high temperature MD, the most-disrupted final structures from the 498 K replicates are shown.

