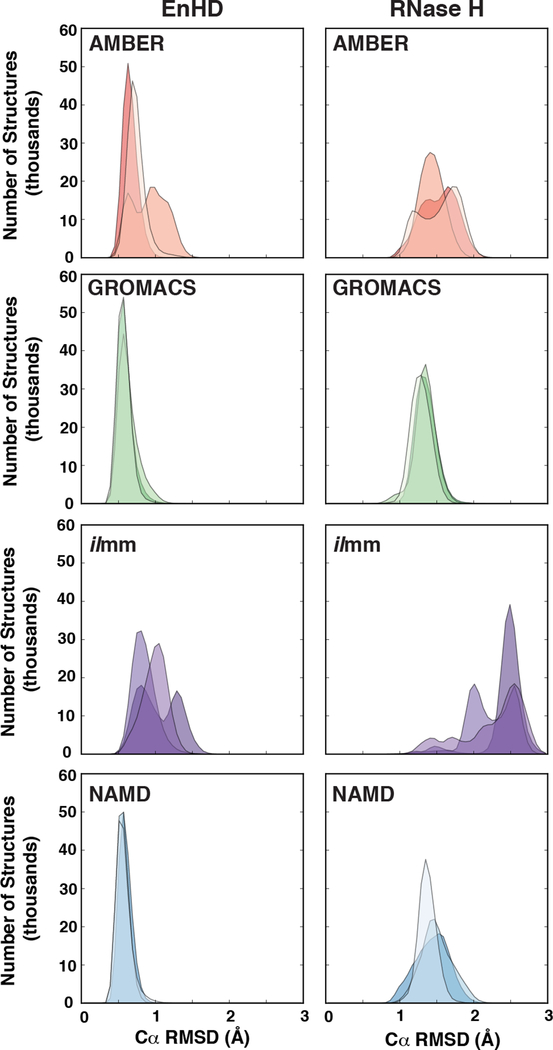
Figure 2. The distribution of Cα root mean squared deviations for EnHD and RNase H.
Overlaid histograms of Cα RMSDs were constructed for each of the three replicate simulations of EnHD (left) and RNase H (right) for simulations performed with AMBER (orange), GROMACS (green), ilmm (purple), and NAMD (blue) at 298 K.

