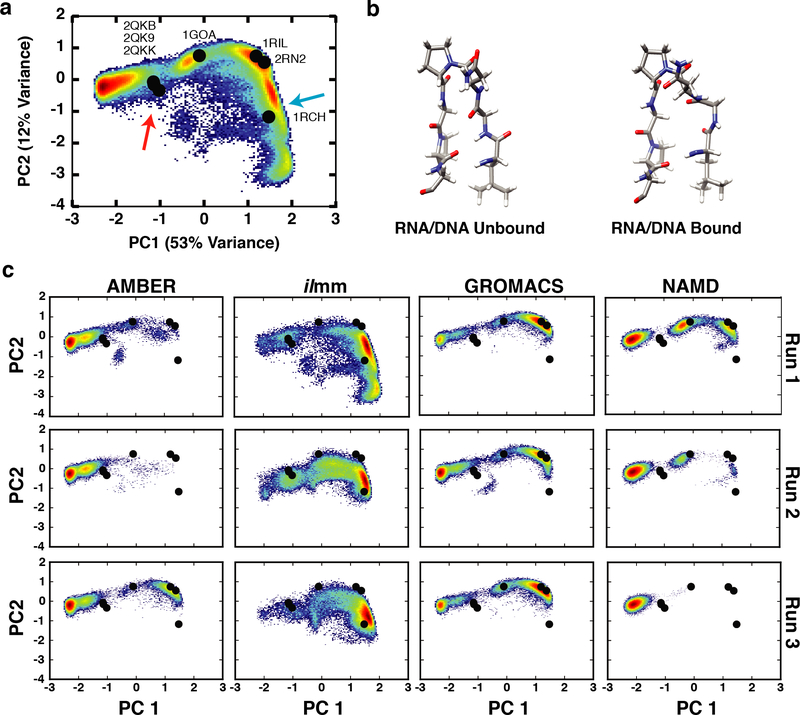
Figure 8. Conformational heterogeneity in the Gly-rich loop.
(a) The dPCA landscape for the residues in the Gly-rich loop, constructed using conformations aggregated from the experimental reference structures and MD simulations, maps the conformational heterogeneity in the Gly-rich loop. Black points denote the location of RNase H reference structures (2RN2, 1RIL, 1RCH, 1GOA, 2QKB, 2QK9, and 2QKK) within the dPCA landscape. The blue arrow denotes the region corresponding to the unbound conformation of the Gly-rich loop in solution (b, left). The red arrow denotes the region corresponding to the DNA/RNA bound conformation of the Gly-rich loop in solution (b, right). (c) Conformations sampled by the Gly-rich loop in MD simulations.

