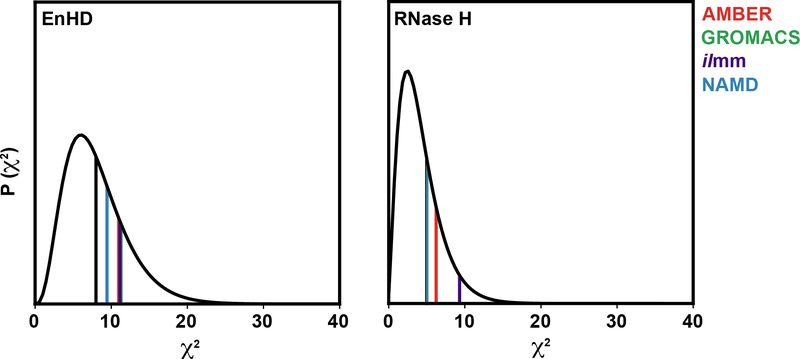
Figure 9. Global correspondence between simulation and experiment as assessed by the χ2 statistic.
Each plot shows the χ2 distribution (black curves) for the degrees of freedom associated with each comparison (8 degrees of freedom for EnHD, left; 5 degrees of freedom for RNase H, right). The vertical lines denote the χ2 value calculated for each force-field/software package combination (AMBER, red; GROMACS, green; ilmm, purple; NAMD, blue) as well as the expectation value for that distribution (black).

