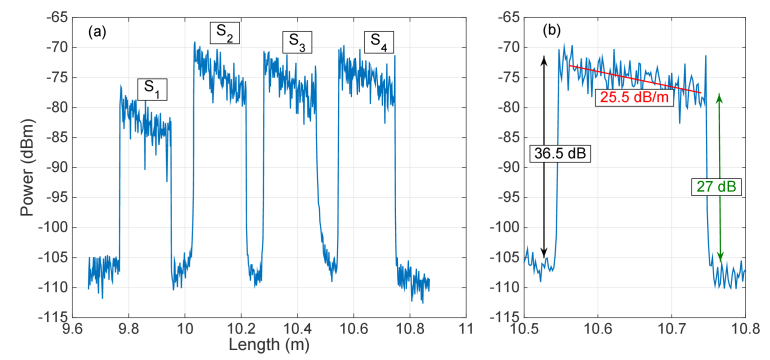
Fig. 4.
Scattering characterization of the proposed setup. (a) Backscattered power as a function of length, as recorded on the OBR, for each fiber length. The chart identifies the 4 sensing regions S1 – S4, each having ~20 cm length of MgO-doped fiber. (b) Inset of the left chart, showing an individual sensing region, with estimation of scattering “gain” G, fiber attenuation 2α, and signal-to-noise ratio.

