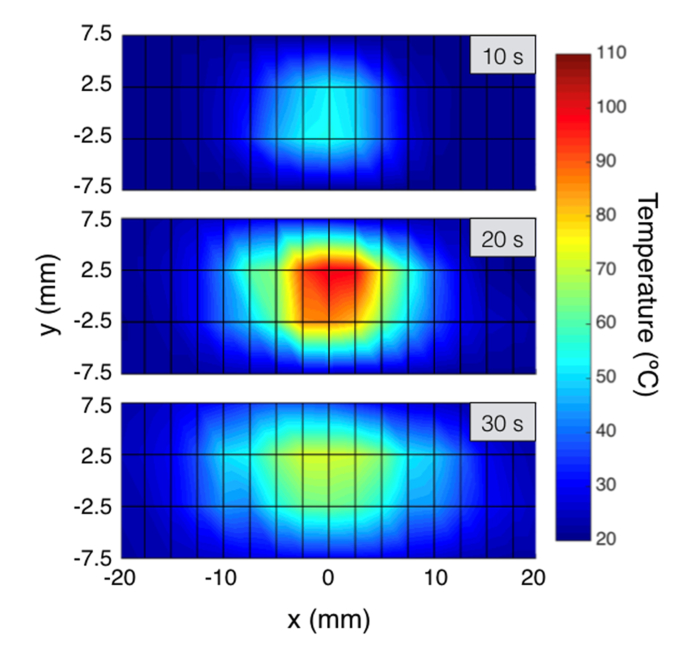
Fig. 6.
Two-dimensional thermal maps, reporting temperature on the xy plane for different elapsed time (10 s, 20 s, 30 s). The plain considered is 15 × 40 mm, corresponding to a grid of 4 × 17 sensing point, spaced 5 mm on y axis and 2.5 mm on x axis. See Visualization 1 (2.3MB, mp4) .

