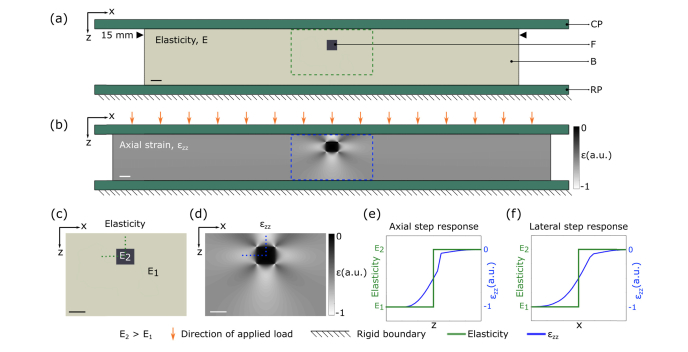
Fig. 1.
Illustration of mechanical deformation in compression OCE. (a) 2D FEA model of a stiff square feature embedded in a softer bulk material (CP: compression plate, F: feature, B: bulk, RP: rigid plate). (b) Corresponding FEA axial strain map after a 15% bulk strain is applied. Close-ups of the regions corresponding to the green rectangle in (a) and blue rectangle in (b) are shown in (c) and (d), respectively. (e) Normalized plots of elasticity (green) overlaid on axial strain (blue) across the axial boundary of the feature marked by the vertical dotted green line in (c) and blue line in (d). Similarly, (f) shows normalized plots of elasticity overlaid on axial strain across the lateral boundary of the feature marked by the horizontal dotted green line in (c) and blue line in (d). Scale bars represent 500 µm.

