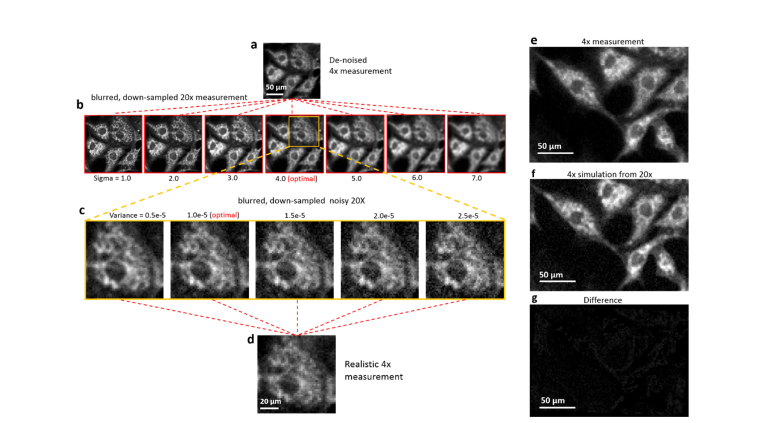
Fig. 2.
Generation of simulated LR inputs via a degradation model. (a) Denoised 4 × LR measurement used for finding the optimized blurring kernel of microscope. (b) The blurred and down-sampled images from 20 × measurement, by different sizes of blurring kernel (Sigma value). (c) Blurred image with optimal blurring is processed with different additive noises and compared to the realistic 4 × measurement. The best matched level of noise is found as a result. (e-g) A 4 × measurement is subtracted by the optimized 4 × simulation to verify the efficacy of the model.

