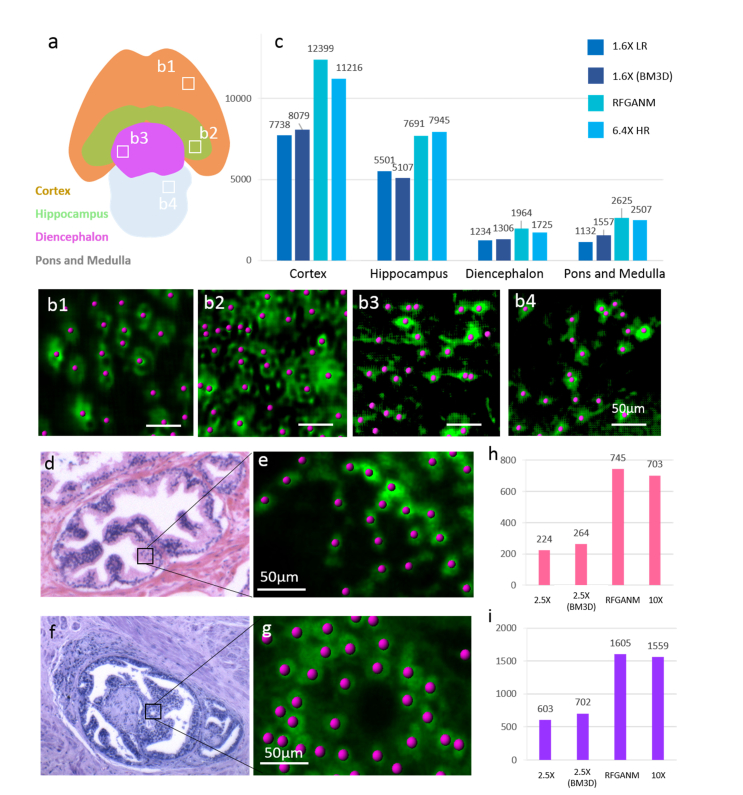
Fig. 10.
Biomedical quantitative analysis based on RFGANM images. (a) The encephalic regions division of the whole mouse brain section. 4 main encephalic regions are segmented as Cortex, Hippocampus, Diencephalon, Pons and Medulla. (b1-b4) Examples of identified and counted neurons in 4 regions, respectively. (c) The calculated cellular populations at different brain regions of (a). The counting results of RFGAM are consistent with those from HR measurements. (d and f) The selected gland areas from RFGANM images of a prostate tissue and a prostate cancer slide, respectively, for cell nuclei counting. (e and g) Examples of identified and counted cell nuclei. (h and i) The counting results of (d) and (f), respectively.

