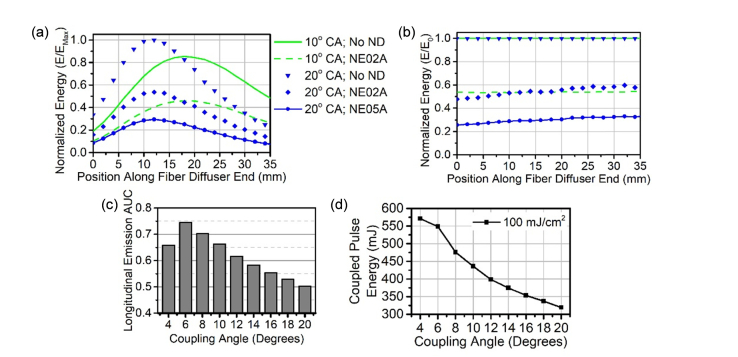
Fig. 5.
Longitudinal emission profiles can be used to determine maximum coupling energy based on the tissue damage threshold. (a) Longitudinal emission profiles for 10° and 20° with and without energy attenuation by ND filters are plotted. The profiles are normalized by the maximum energy (EMax). Figure legend also applies to b. (b) The longitudinal emission profiles were also normalized by the profile without a ND filter (E0). (c) AUC values for longitudinal emission profiles are illustrated over increasing coupling angle. (d) Based on the AUC and the side conversion efficiency at increasing coupling angles, the maximum coupling energy is shown based on 100 mJ/cm2/pulse maximum fluence rate. CA: coupling angle; ND: neutral density filter; NE02A: 0.2 ND filter; NE05A: 0.5 ND filter. AUC: area under the curve.

