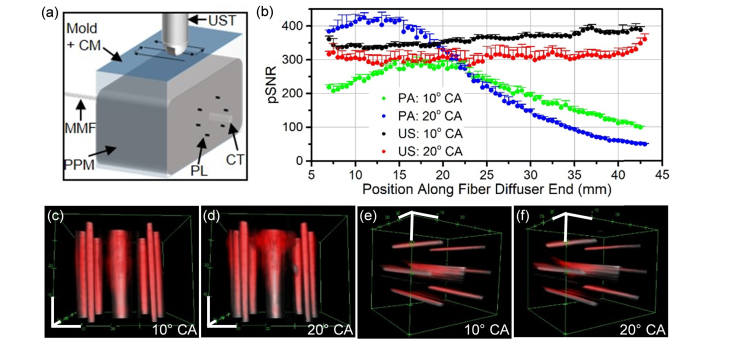
Fig. 7.
PA and US signal generated over the prostate tissue-mimicking phantom without moving the illumination source. (a) Schematic shown of experiment. (b) PA and US pSNR from pencil lead targets embedded in prostate tissue-mimicking phantom is graphed over the position along the fiber diffuser from the proximal to distal end. (c-f) Snapshots of 3-dimensional composites comprised of both the US channel (gray) and PAT channel (red) are displayed with 1 cm axis scale bars (white). Snapshots in c and d subpanels have a top-down view, while e and f subpanels’ view is of signal from the distal to proximal end of the diffuser. The dynamic range is consistent between all subpanels. The US channel of the composites is in arbitrary units converted to log scale with a range from 10.02 to 14.70, and the PAT channel of the composites is in arbitrary units in the linear scale with a range from 5,397 to 76,920. CM: coupling medium; UST: ultrasound transducer; MMF: multimode fiber; PPM: prostate phantom mixture; PL: pencil lead; CT: capillary tube; CA: coupling angle.

