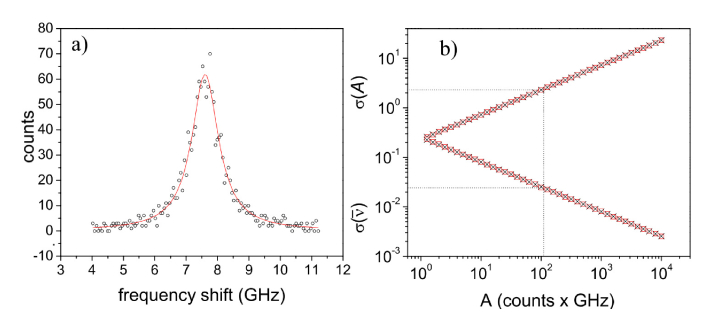
Fig. 2.
(a) Lorentzian curve with A = 102 counts·GHz (circles), ν0 = 7.6 GHz and Γ = 1GHz, together with fit results obtained using a Lavembergue-Marquardt minimization routine (red line), giving σ(ν0) = 0.01 GHz and σ(Α) = 2 counts·GHz. (b) Calculated (black crosses, Eq. (3)) and simulated (red squares) variances associated with the intensity and average frequency.

