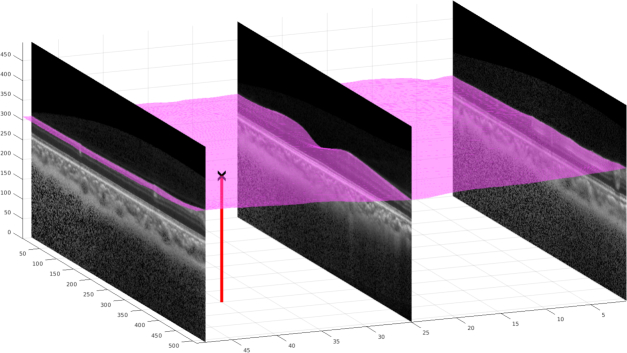
Fig. 5.
Representation of the ILM surface. The red line segment shows the height of the ILM (320 voxels in this case) at the A-scan of the B-scan. Therefore in the 2D array representation of the ILM surface, the value at location is 320. For a OCT volume, since there are 1024 × 49 A-scans, the 2D array for the ILM surface is of size 1024 × 49. In total nine 1024 × 49 2D arrays are needed to fully represent all nine boundaries.

