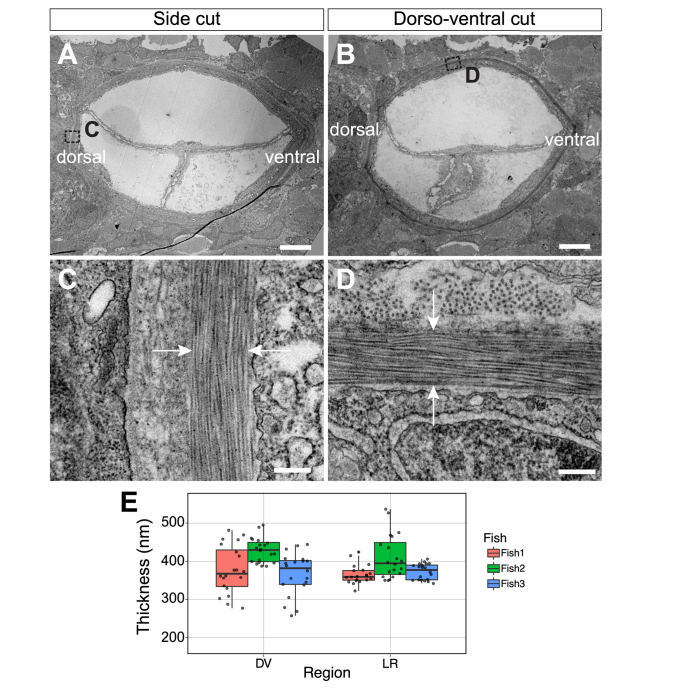
Fig. 3.
(A-B) Low magnification TEM of transverse notochord after side (A) and dorso-ventral (B) cuts of a Tg(col9a2:GFPCaaX) zebrafish embryo at 3 dpf and ~200-250 µm anterior from the posterior end of the notochord. (C-D) High magnification TEM of transverse view ECM (between white arrows) after side (C) and dorso-ventral (D) cuts. (E) Quantification of ECM thickness in left-right (LR) and dorso-ventral (DV) regions of 3 embryos. Scale bars, 5 μm in (A and B) and 250 nm in (C and D).

