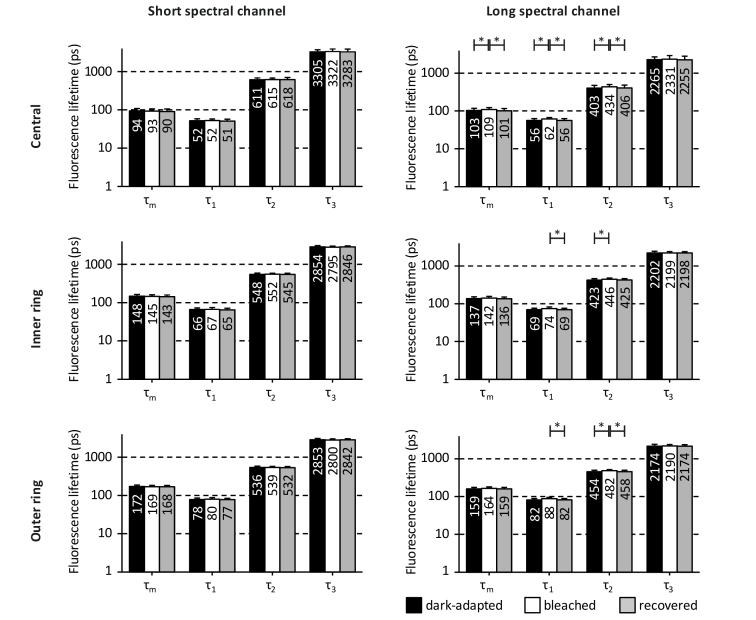
Fig. 4.
Fluorescence lifetimes of the different bleaching states at different fundus locations. The fluorescence lifetimes are presented as mean ± standard deviation for both spectral channels in the central area, the inner ring, and the outer ring of the ETDRS grid. Significant differences are marked by * (p < 0.05). The differences between dark-adapted and bleached states of fluorescence lifetime τ1 in the long spectral channel occurred at trend level for the outer ring (p = 0.092). The plots are on a logarithmic scale, and values are rounded to the nearest decimal.

