
Fig. 1. Map indicating locations of the sampling sites for parasite isolates from three provinces in Thailand and other regions worldwide.
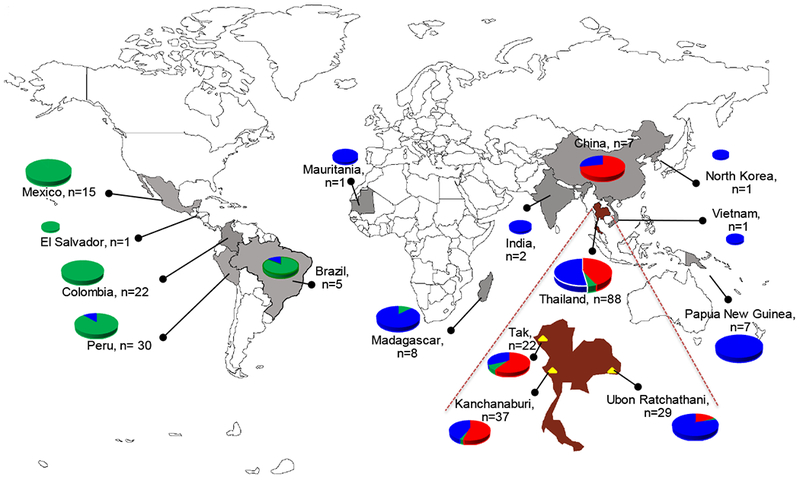
In addition to the origin of the samples, the distribution of the three clusters of Pvmdr1 haplotypes in each country or region based on the STRUCTURE plot (Blue, Green and Red) in Fig. 3 is shown as pie charts. The world map was modified from the one available on: www.freeworldmap.net.