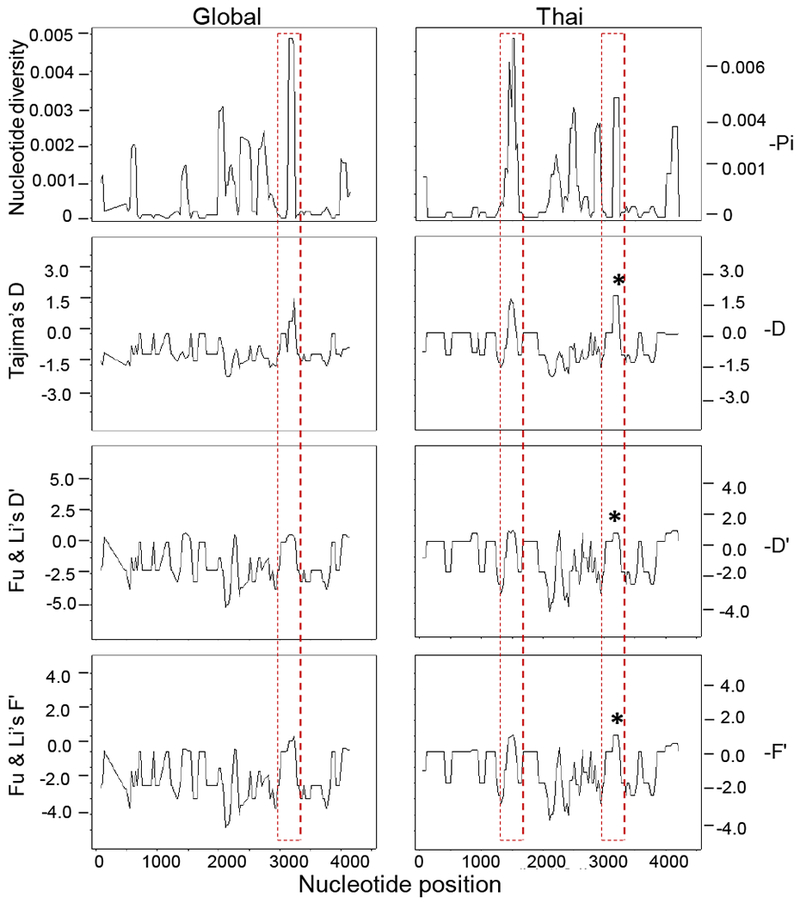
Fig. 2. Sliding window plots of nucleotide diversity and results of the neutrality tests from the global (left) and Thai (right) Pvmdr1 sequences.

Peaks of diversity consistently shown in all analyses suggestive of balancing selection or population decline, thus, an excess of alleles at intermediate frequencies are marked by red dotted rectangles and correspond to positive values. The star plotted above the peaks depicts the statistical significance of the test at the level 0.05. Sliding window analysis used a window size of 100 bp and a step size of 10 bp. Nucleotide positions correspond to those of Sal I sequence.
