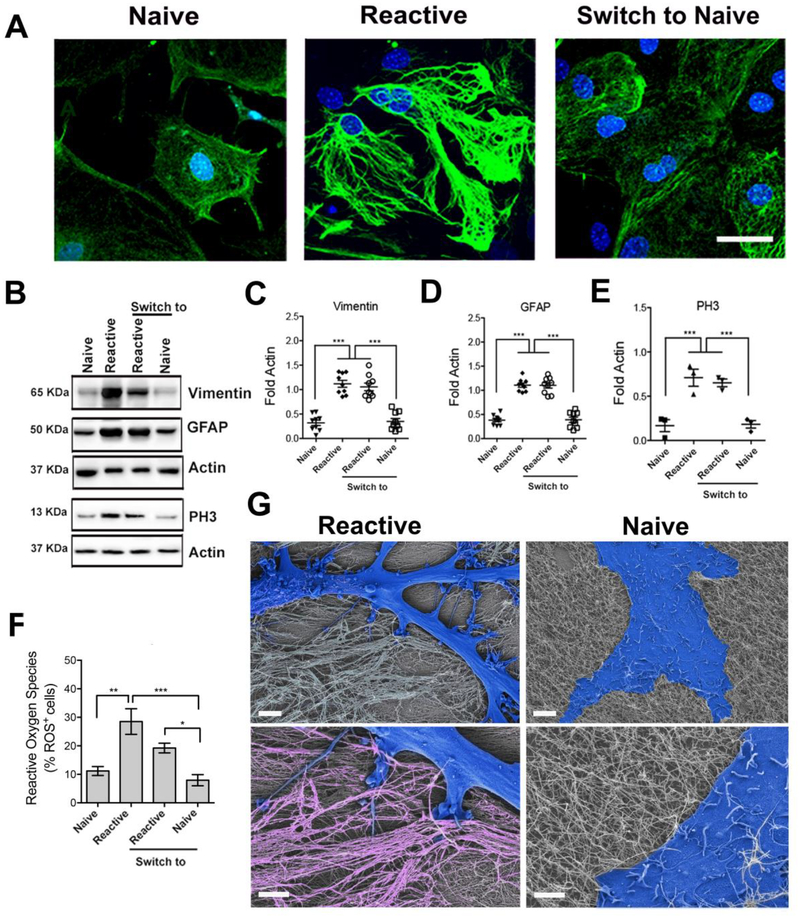
Figure 4. Modulating the phenotype of astrocytes on reversible hierarchical ECM mimetic.
(A) Confocal microscopy images of astrocytes plated on individual fibers (left), on bundled fibers (center), and after switching from bundles to individual fibers (right). Staining for GFAP (green) and cell nuclei (DAPI, blue) reveals cells with naive morphology on substrates of individual fibers and reactive morphology on substrates of bundled fibers. Scale bar: 50 μm, pertaining to all images. (B) Western blot analysis of protein expression (related to cytoskeleton and cell proliferation) in astrocytes on indicated substrates. (C-E) Relative expression of proteins derived from western blots in B. All values were normalized to Actin expression; three experiments were analyzed. (*p<0.05; **p<0.01; ****p<0.0001, LSD test). (F) Reactive oxygen species (ROS) quantification on the different substrates relative to cell number. (*p<0.05; **p<0.01; ****p<0.0001). (G) SEM micrographs of a reactive cell on bundled fibers and a naïve cell on individual fibers. Cells are falsely colored in blue. The magnified view (lower images) shows the cell-substrate interaction. Bundles are falsely colored in pink. Scale bars: 5 μm (upper images), 2 μm (lower images).

