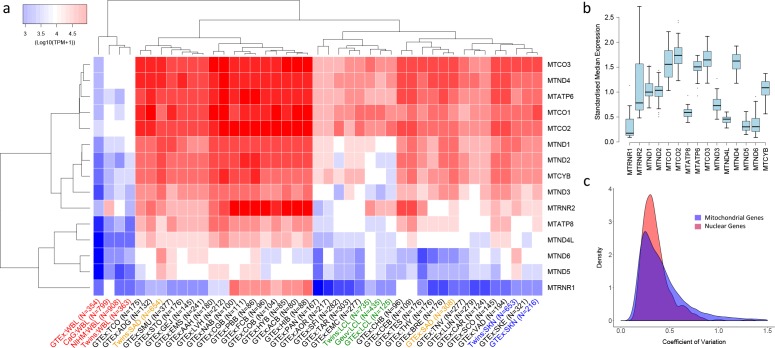
Figure 1. Variation in the expression of mitochondrial-encoded genes across datasets.
(A) Hierarchical clustering of median expression levels per gene across all datasets where WBL = Whole Blood, SAD = Subcutaneous Adipose, LCL = Lymphoblastoid cell lines, SKN = Non sun exposed skin, SKE = Sun exposed skin, VAD = Visceral omentum adipose, ADG = Adrenal gland, AOR = Aorta, CAR = Coronary artery, TAR = Tibial artery, ACB = Anterior cingulate cortex (BA24) (Brain), CGB = Caudate basal ganglia (Brain), CHB = Cerebellar Hemisphere (Brain), CEB = Cerebellum (Brain), COB = Cortex (Brain), FCB = Frontal cortex (BA9) (Brain), HIB = Hippocampus (Brain), HYB = Hypothalamus (Brain), NAB = Nucleus accumbens (basal ganglia) (Brain), PBB = Putamen basal ganglia (Brain), BRE = Breast mammary tissue, SCO = Sigmoid colon, TCO = Transverse colon, GEJ = Gastroesophageal junction, EMC = Esophagus mucosa, EMS = Esophagus Muscularis, AAH = Atrial appendage (Heart), LVH = Left ventricle (Heart), LUN = Lung, SMU = Skeletal muscle, TNV = Tibial Nerve, PAN = Pancreas, SFI = Transformed fibroblasts, STO = Stomach, TES = Testes and THY = Thyroid, Multi-dataset tissues on the x-axis are shown in red (whole blood), orange (subcutaneous adipose), green (lymphoblastoid cell lines) and blue (non-sun exposed skin). (B) Standardized expression levels of each mitochondrial-encoded gene across all independent datasets, (C) Coefficient of variation across individuals for the expression levels of mitochondrial encoded genes and the top 1000 most highly expressed nuclear genes in all datasets. Range of coefficient of variation is restricted to between 0 and 1.5 as this contains the majority of the data.

