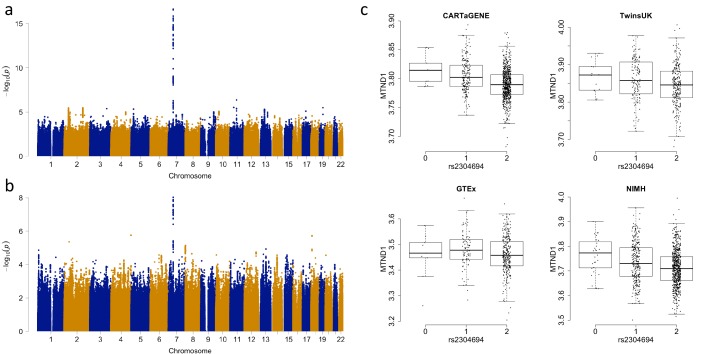
Figure 2. Associations between the expression of MTND1 and rs2304694 in whole blood data.
(A) Genome-wide association analysis for the expression of MTND1 in whole blood data from the discovery datasets (meta-analysis of CARTaGENE, TwinsUK and GTEx data), (B) Genome-wide association analysis for the expression of MTND1 in whole blood data from the replication dataset (NIMH data), (C) Expression of MTND1 (Log10(TPM +1)) versus non-reference allele frequency of rs2304694 in the four independent whole blood datasets.


