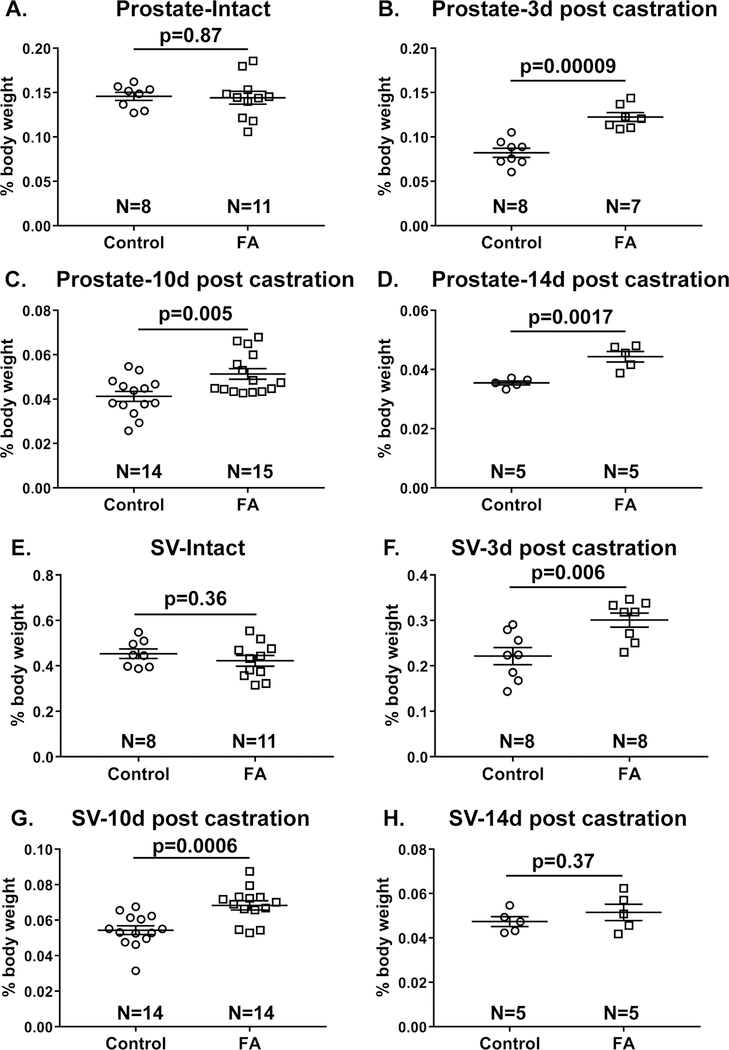
Figure 2. Mice fed a FA enriched diet and then castrated have greater prostate and seminal vesicle weights than mice fed a control diet and castrated.
Relative prostate and seminal vesicle (SV) wet weights were determined as percentage of mouse body weight for: (A, E) Intact mice or mice (B, F) 3 days (C, G) 10 days (D, H) or 14 days post castration. N value indicates number of mice/group. Results are presented as mean ± SEM. Homogeneity of variance was tested using Bartlett’s test. p-values represent results from unpaired Student’s t-test between diet groups for each treatment.

