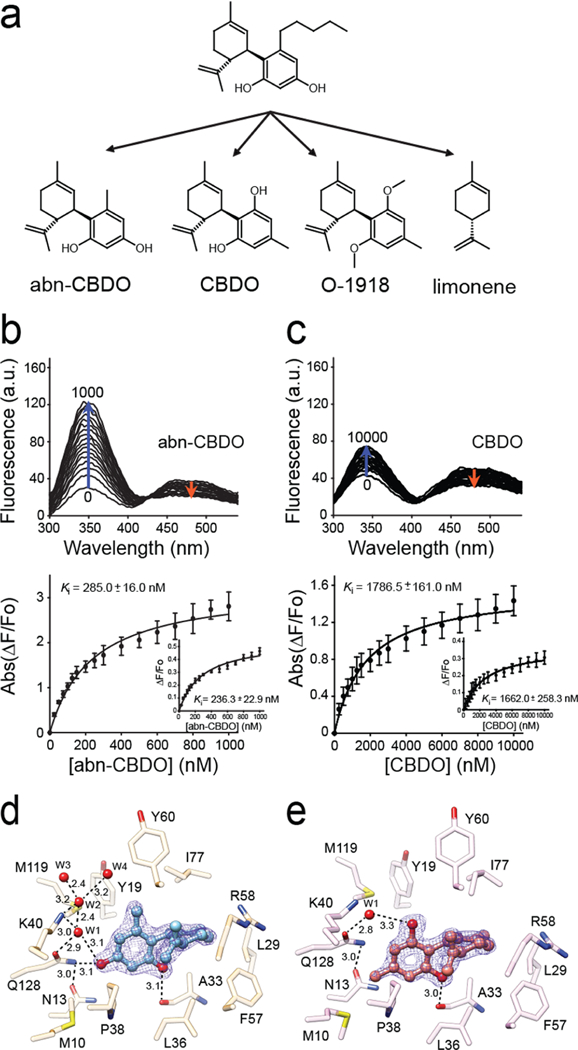
Figure 5. A relationship between structure of cannabinoid ligands and their affinity.

(a) Chemical structures of abn-CBD derivatives used in the experiments. (b, c) Changes in the fluorescence emission spectra upon titration with abn-CBDO and CBDO, respectively. Ki values were calculated by fitting the experimental data to the one-site saturation ligand-binding model. (d) Interactions of abn-CBDO inside the binding cavity of CRBP1 as revealed by the X-ray crystallography (PDB No. 6E5T). (e) Orientation of CBDO inside of the binding pocket (PDB No. 6E6M). The absence of a hydroxyl group in the para position in CBDO determines weaker interaction of this ligand with CRBP1. The 2Fo − Fc electron density maps were contoured at 1.4σ. Ordered water molecules (W) are shown as red spheres; dashed lines indicate hydrogen bonds. Distances are shown in angstroms.
