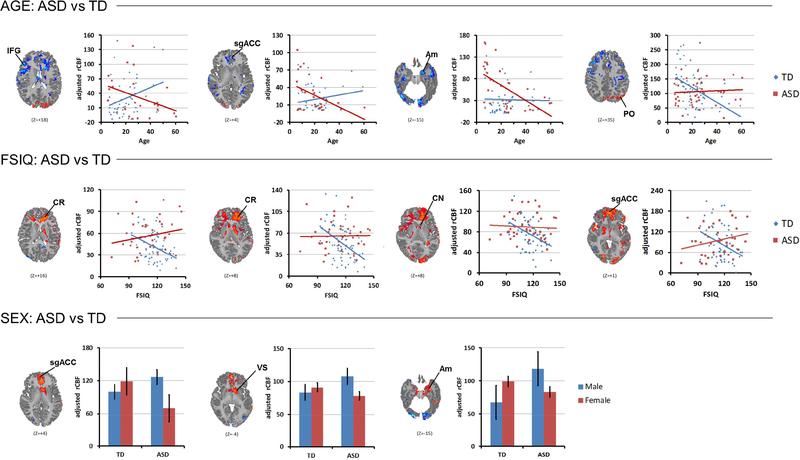
Figure 3. Data Displays for Age, Sex, and FSIQ Effects.
These are shown for representative regions indicated from a slice taken from Figure 2, shown above each plot in the statistical map. The line leading from the regional label to the image indicates the voxels with the images that were sampled to generate the data shown in the scatterplots. The scatterplots illustrate the age-related decline in rCBF in most cortical regions for ASD and the inverse correlation of rCBF with full scale IQ (FSIQ) in the TD but not ASD group. Bar graphs for sex effects demonstrate in ASD participants the reversal of female>male sex differences present in the TD group. Error bars represent standard error.

