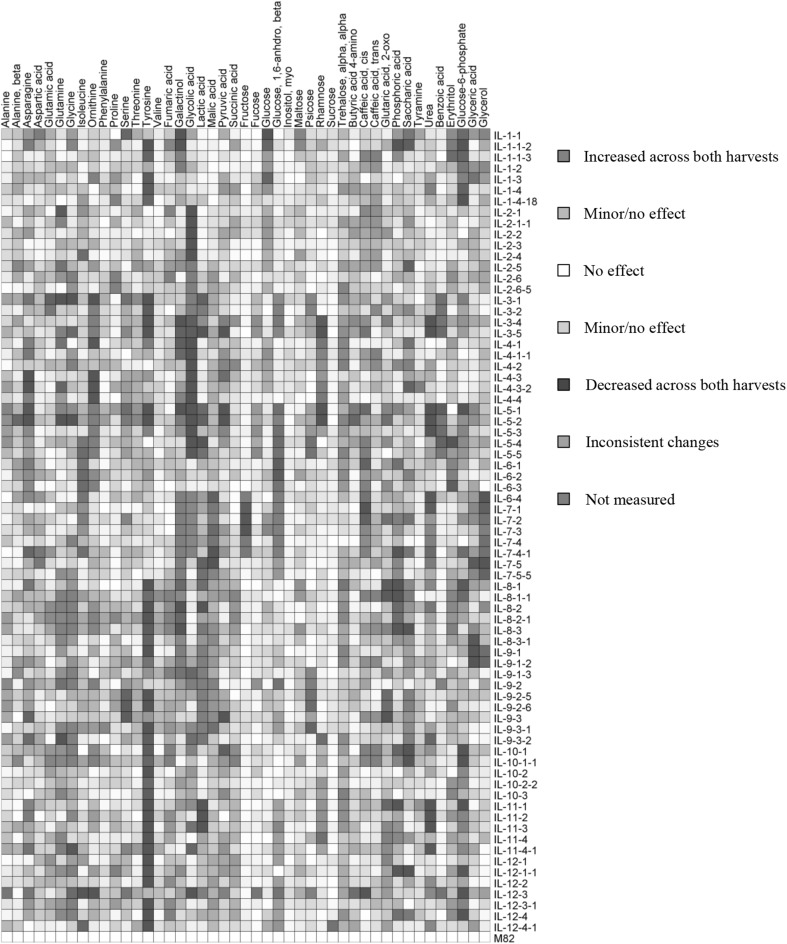
Fig. 2.
Overlay heat map of the metabolite profiles of two independent studies of the leaf metabolite content of the ILs compared with the parental M82. Data represent measurements of leaf material harvested from two independent experiments presented as a heat map. Large sections of the map are white or pale in color and reflect that many of the chromosomal segment substitutions do not have an effect on the amount of every metabolite. Regions of red or blue indicate increased or decreased metabolite content, respectively, after introgression of Solanum pennellii segments. Very dark coloring indicates that a large change in metabolite content was conserved across both harvests, whereas purple indicates an inconsistent change in that IL relative to M82. For each harvest, GC-TOF-MS was used to quantify primary metabolites, including amino acids, organic acids, sugars and other metabolites. The ILs are presented in chromosomal order from top of chromosome 1 to base of chromosome 12 from top to bottom. A total of 76 ILs and 42 metabolites overlapped in both experiments

