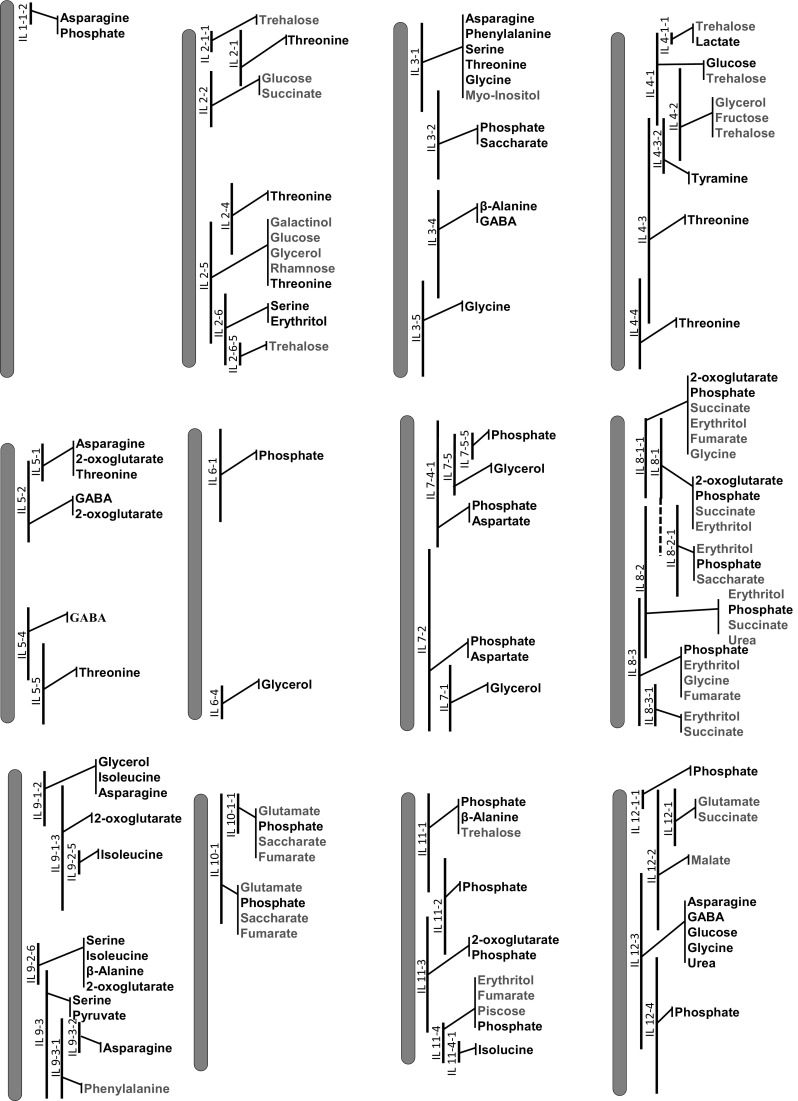
Fig. 3.

QTL map of significant changes conserved in the metabolite traits in both experiments (Exp1 and 2) of Solanum pennellii ILs (black bar) into a genetic background of Solanum lycopersicum (M82). Red and blue indicate increased and decreased levels of metabolites, respectively, in relation to M82, as identified by t-test (p value ≤ 0.05)
