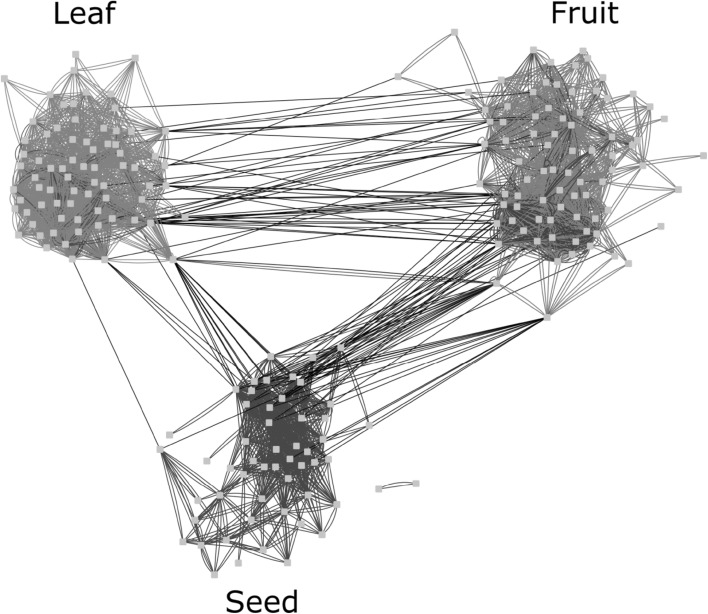
Fig. 5.
Leaf-fruit-seed metabolite relevance network. Metabolite relevance networks have been inferred for each tissue. Green, red and blue edges correspond to the tissue specific relationships between metabolites in leaf, fruit, and seed, respectively. Black edges indicate the relationship between metabolites from different tissues

