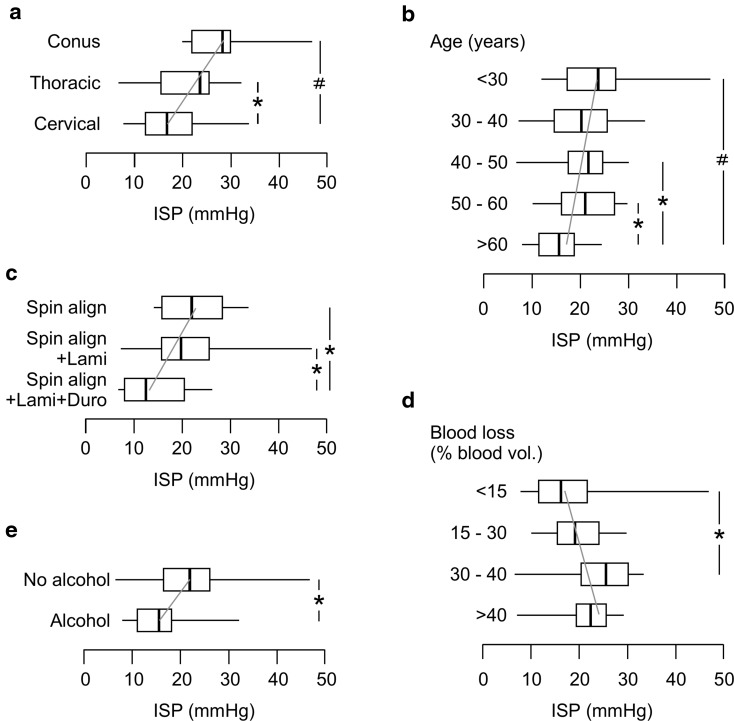
Fig. 2.
Factors that correlate with mean ISP. a Level of spinal cord injury (cervical, thoracic, conus). b Age group in years (< 30, 30 – 40, 40 – 50, 50 – 60, > 60). c Extent of decompression (Spinal Alignment, Spinal Alignment + Laminectomy, Spinal Alignment + Laminectomy + Duroplasty). d Intraoperative blood loss as % of total blood volume (< 15%, 15 – 30%, 30 – 40%, > 40%). e Excess alcohol consumption. Box plots show median, upper and lower quartiles, minimum and maximum. Gray trend line. P < 0.05*, 0.005#

