
Fig. 2.
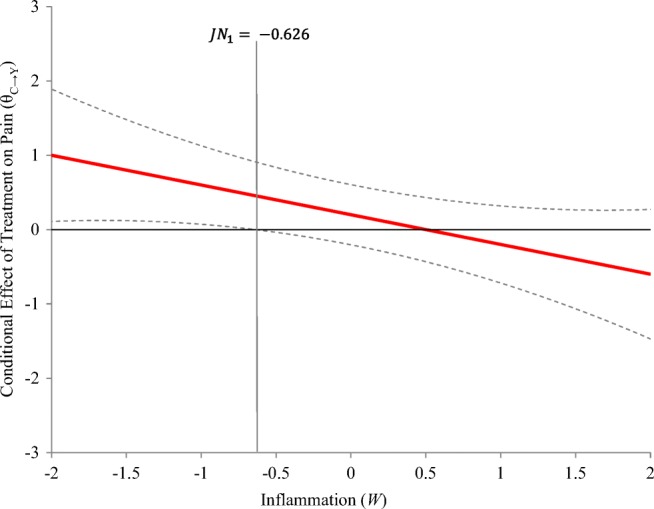
Graph of the conditional effect of treatment (C) on pain (Y) as a linear function of inflammation (W) including the Johnson–Neyman transition point (JN). The JN point is where the confidence interval around the condition effect intersects zero on the y-axis