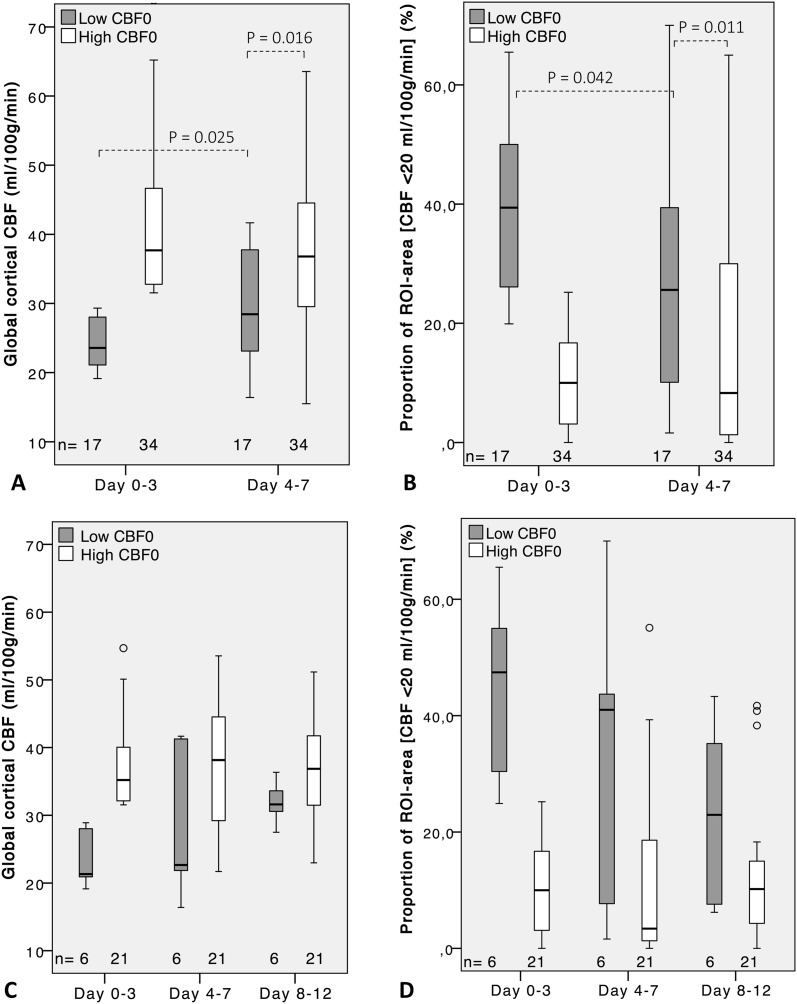
Fig. 3.
Global cortical CBF and proportion of ROI area with local CBF < 20 ml/100 g/min at different phases in the acute course of SAH for patients grouped by high or low early global CBF at day 0–3, cutoff 30 ml/100 g/min. a, b Boxplots (median, IQR) for subgroup 04 (n = 51) with measurements at day 0–3 and 4–7. c, d Boxplots for subgroup 048 (n = 27) with measurements at day 0–3, 4–7, and 8–12

