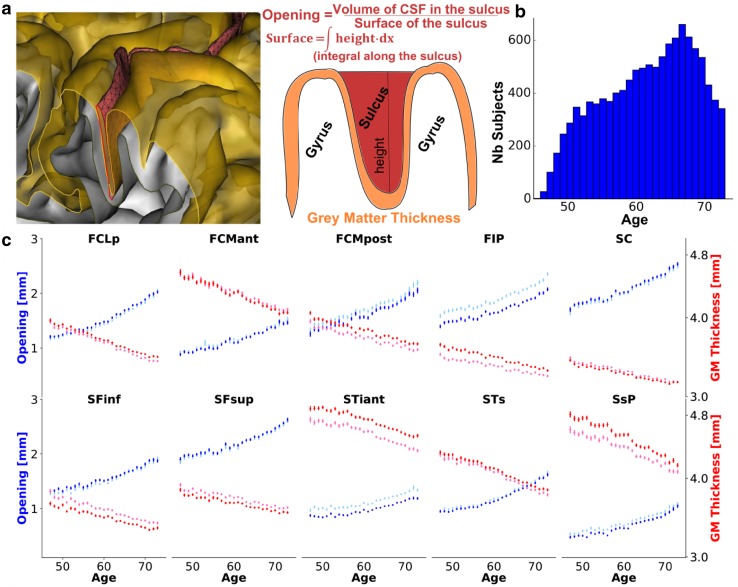
Fig. 1.
Evolution of sulcal opening and grey matter thickness with age in the main brain sulci. a Schematic definition of the opening and grey matter thickness for the Brainvisa sulci. b Age distribution in the UK Biobank sample with MR Imaging. c Mean opening (red) and mean grey matter thickness (blue) vs age. (light blue and light red represent left hemisphere values; dark blue and red represent right hemisphere values). Main sulci annotation is described on Fig. 2

