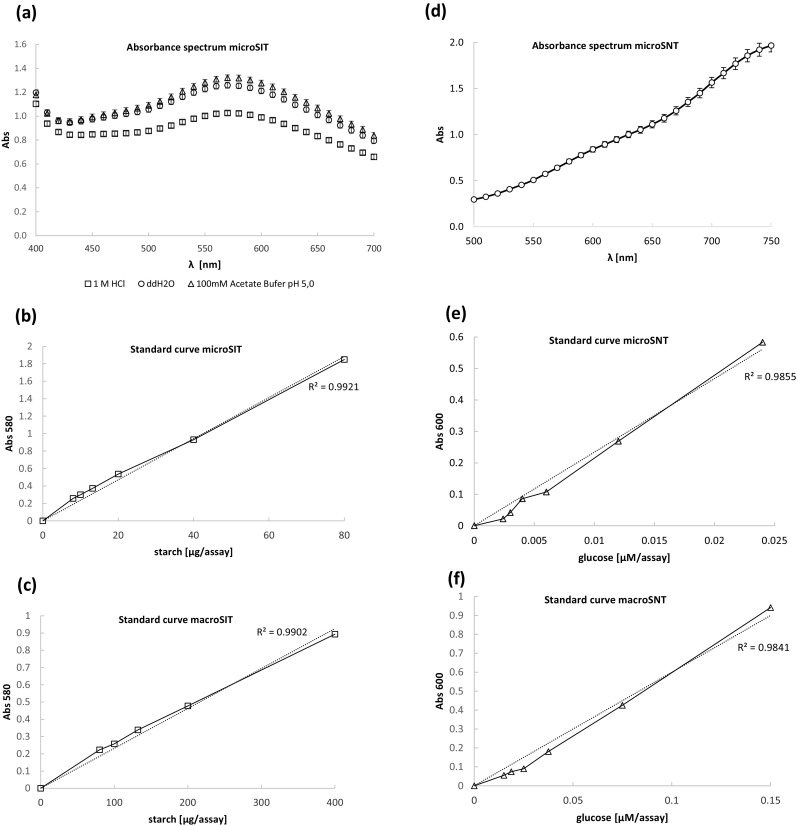
Fig. 1.

Absorbance spectra and standard curves of the assays. a Absorbance spectrum of chromogenic complex obtained in microSIT assay, analyzed as described in sections 2.3. and 2.3.2 after addition of 10 μL of 1 M HCl (□), or ddH2O(○), or 100 mM acetate buffer pH 5.0 (Δ); d Absorbance spectrum of chromogenic complex obtained in microSNT assay, analyzed as described in section 2.3.1. Standard curves for microSIT (b), macroSIT (c), microSNT (e), macroSNT (f) assay. X axis: λ wavelength [nm] (a, d); concentration of starch [μg/assay] (b, c); concentration of glucose [μmol/assay] (e, f); Y axis: absorbance values at: various wavelengths (a, d), at 580 nm (b, c), and at 600 nm (e, f) wavelength. The two curves in (b, c, e, f) correspond to the experimental results and the trend curve, provided with R2 coefficient. Error bars indicate ±SD from triplicates
