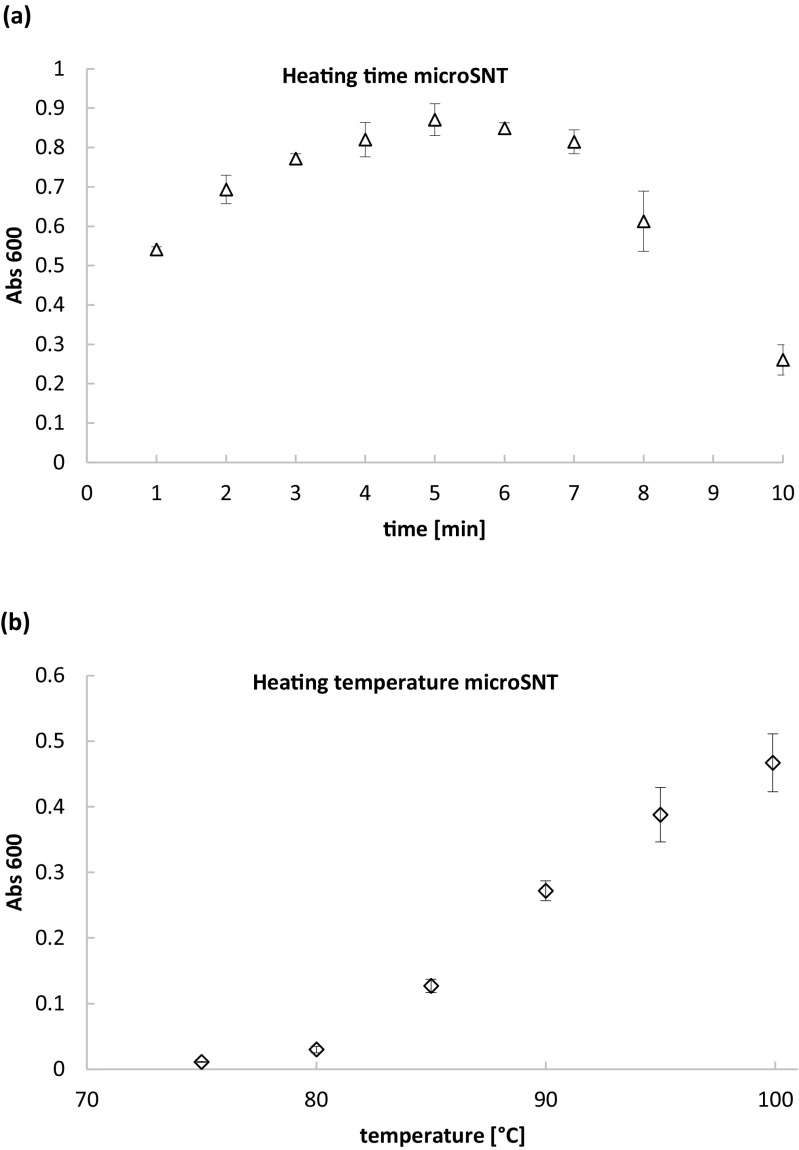
Fig. 2.
Effect of duration (a) and temperature (b) applied to a heating step in microSNT assay on copper ions reduction degree. The test was conducted as described in sections 2.3. and 2.3.1 using 0.6 mM glucose solution. X axis: duration of the heating step [min] (a), temperature of heating [°C] (b), Y axis: absorbance values at 600 nm wavelength (Abs 600), reflecting degree of the copper ions reduction. Error bars indicate ±SD from triplicates

