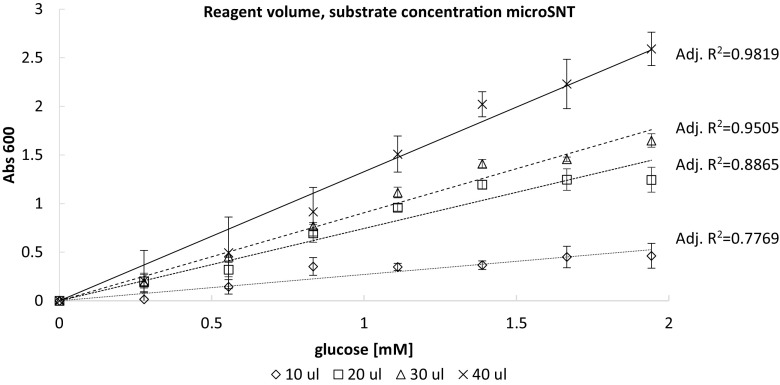
Fig. 3.
Effect of Nelson’s copper reagent volume on course, linearity and range of the standard curve in microSNT assay. The test was conducted using standard glucose solution covering the concentrations ranging from 0.28 to 1.94 mM according to the methodology described in sections 2.2. and 2.3.1. Diamonds (◊), squares (□), triangles (Δ) and crosses (x) indicate tests conducted with 10, 20, 30 and 40 μL of Nelson’s reagent, respectively. Continuous, wider dashed, narrower dashed, and dotted black lines indicate regression curves for microSNT assay with 10, 20, 30, and 40 μL of Nelson’s copper reagent, respectively. Given Adj. R2 coefficients (calculated as described in section 2.3.3) are provided in sequence starting from the highest (top) to the lowest (bottom) volume of Nelson’s copper reagent; for accompanying statistical analysis see Table S1. X axis: glucose concentration [mM]; Y axis: absorbance values at 600 nm wavelength (Abs 600), reflecting degree of the copper ions reduction. Error bars indicate ±SD from triplicates

