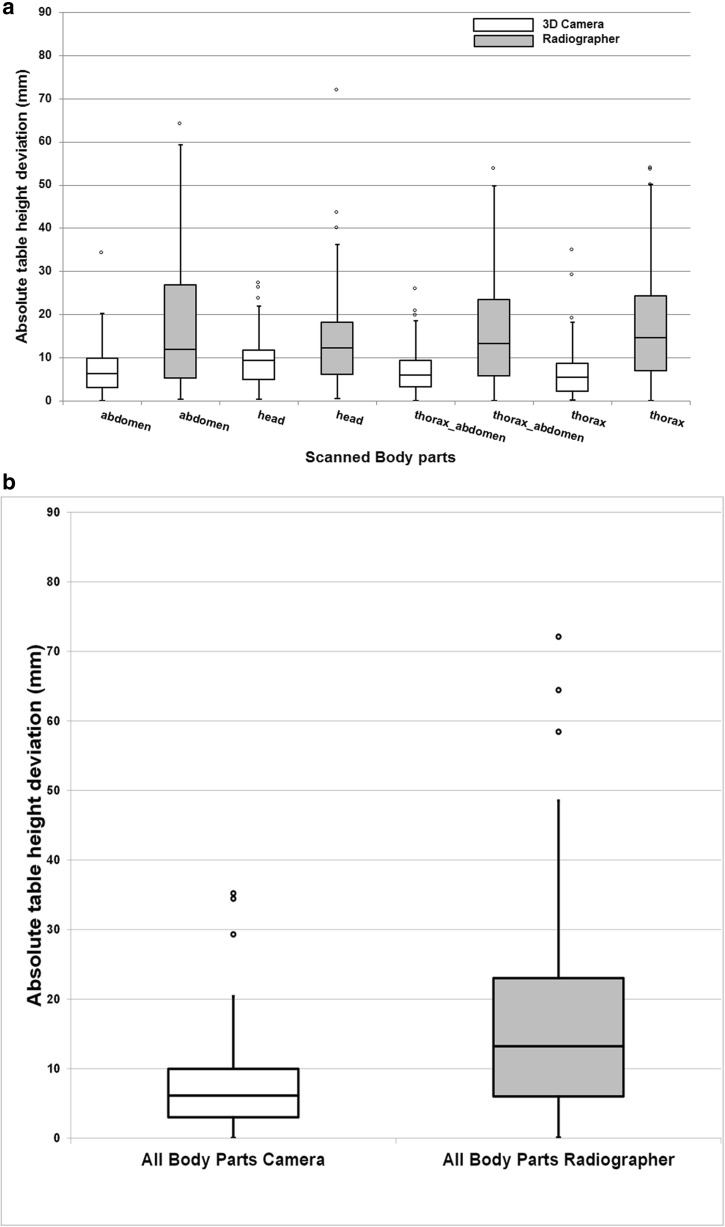
Fig. 3.
a Box-and-whisker plots of patient positioning performance of all different body parts separately for the radiographers and the 3D camera. b Box-and-whisker plots of patient positioning performance of all different body parts combined for the radiographers and the 3D camera. The median (horizontal line within box), interquartile range (box), and nonoutlier range (whiskers). The largest deviations from the scanner isocenter are plotted as open dots and represent values outside the nonoutlier range of the IQR; the latter computed as 1.5 times interquartile range (i.e., 25–75%)

