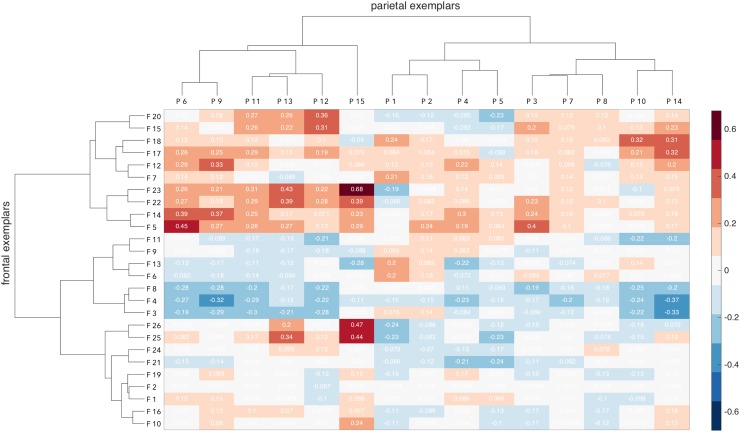
Fig. 2.
Connectivity fingerprints of the frontal exemplars (rows) and the parietal exemplars (columns), along with their hierarchical clustering outline. Values indicated in each cell correspond to the correlation value of the corresponding frontal and parietal exemplars, as shown in Fig. 1. Color bar ranges from the lowest to the highest correlation value of the exemplars

