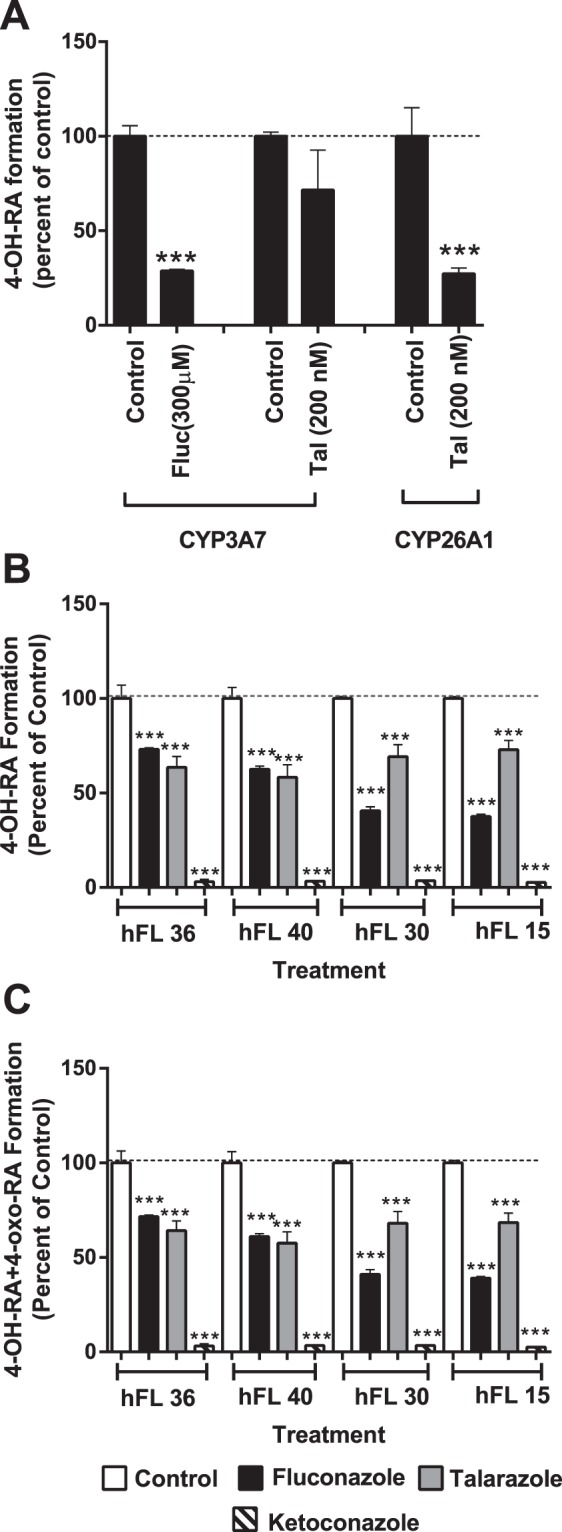
Figure 4.

Inhibition of atRA metabolism by specific CYP inhibitors. Panel A shows the inhibition of 4-OH-RA formation by CYP3A7 inhibitor fluconazole (fluc, 300 μM) and the CYP26 inhibitor talarozole (tal, 200 nM). atRA concentrations were 10 μM and 500 nM in the CYP3A7 and CYP26 incubations. Panels B and C show the percentage inhibition of 4-OH-RA (B) and 4-OH-RA + 4-oxo-RA (C) formation in four representative human fetal livers (hFL, numbers correspond to sample identifiers) by fluconazole (black bars), talarozole (grey bars), and ketoconazole (striped bars) in comparison to vehicle controls (white bars). The stars (***) indicate a significant difference between the incubations with the indicated inhibitor and vehicle control. The numbers indicate the donor codes for the fetal liver donors.
