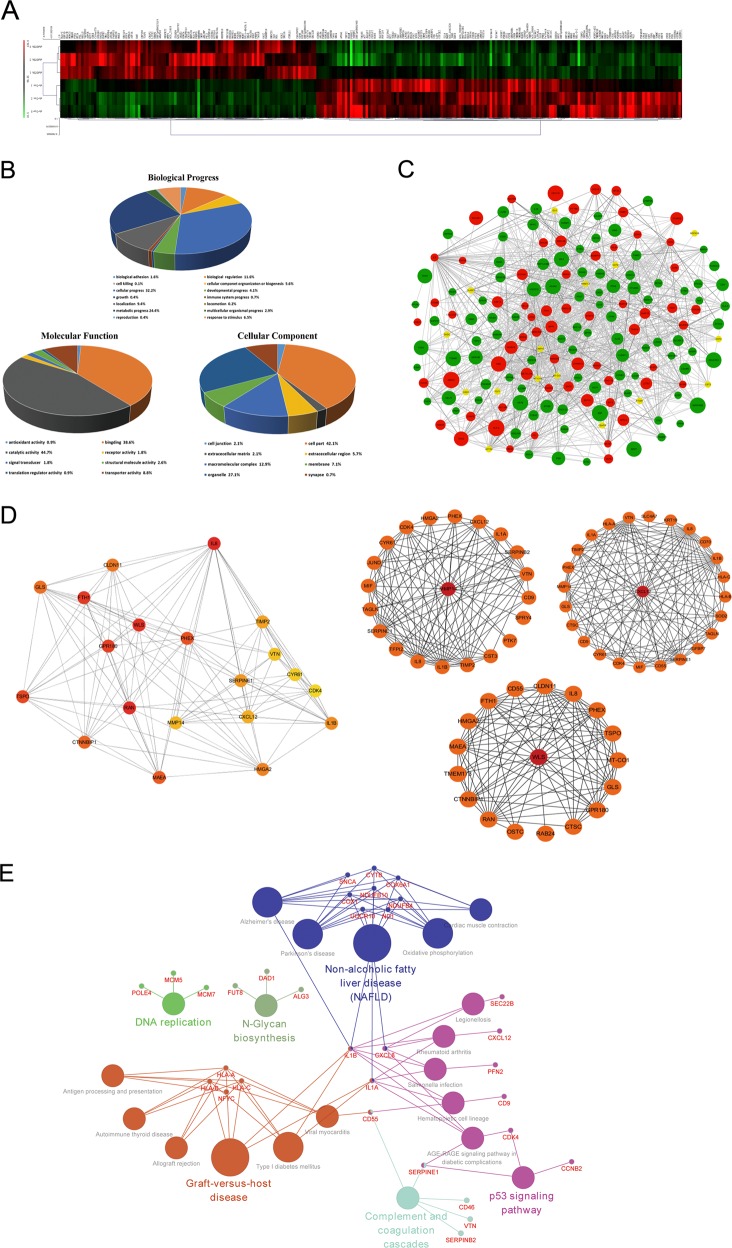
Fig. 4. Bioinformatics analysis.
a Heatmap of altered proteins. A total of 99 and 142 proteins were up- or downregulated with AID silence. b Classification of the identified proteins (including biological process, molecular function and cell component) by GO database. Once more than one function was enriched for an altered protein, all the functional annotations were incorporated in the analyses. c PPI network established by Cytoscape software. The red and green nodes indicate up- or downregulation, respectively, and the yellow node means the protein is not significantly enriched after AID silence, but closely associated with the altered proteins. The diameter of the node is inversely proportional to the P value. d Key factors screened by cytoHubba plug-in and gene annotation. The deeper the colour of the node, the more significant the protein at regulatory position is. Furthermore, according to the previous study of bladder cancer and GO analysis, MMP14, CXCL12 and WLS were finally screened out. e The KEGG pathway enrichment of AID-associated proteins. Nodes with larger sizes denote the KEGG pathway terms; the ones with smaller sizes denote the associated proteins. The nodes with more than one colour indicate that they are involved in multiple pathways

