Figure 2.

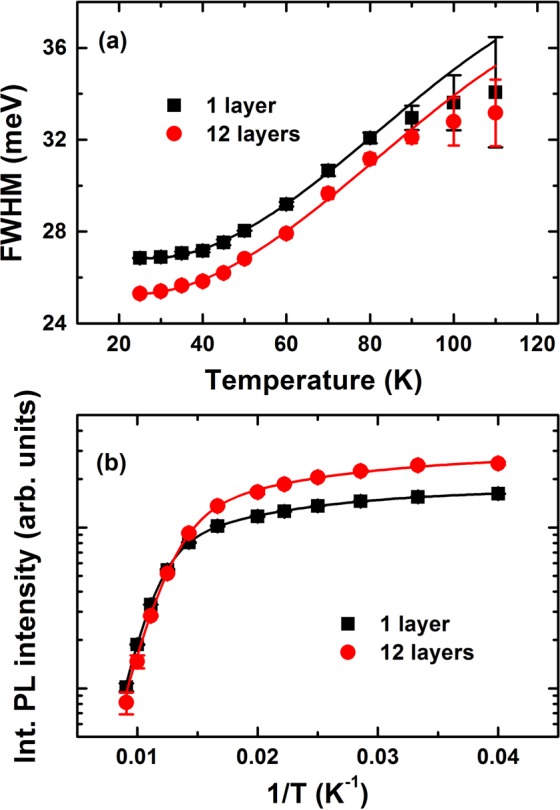
(a) Measured (symbols) and calculated (solid lines) FWHM; and (b) Integrated PL intensities as a function of the reciprocal temperature for the stacked CdTe/ZnTe QDs. The line shows the best fit curve using the model described in the text.

(a) Measured (symbols) and calculated (solid lines) FWHM; and (b) Integrated PL intensities as a function of the reciprocal temperature for the stacked CdTe/ZnTe QDs. The line shows the best fit curve using the model described in the text.