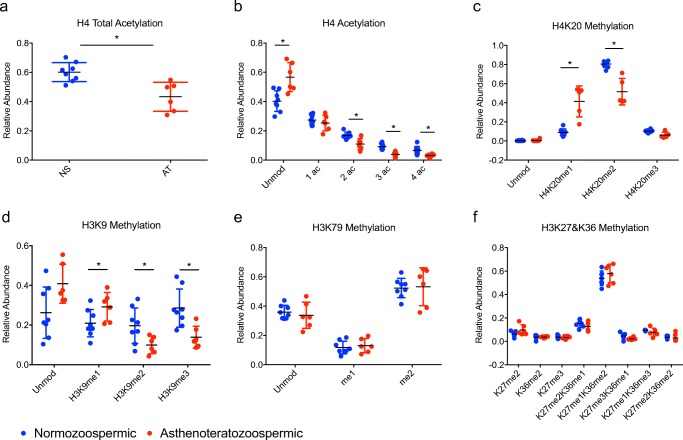
Fig. 2.
Relative abundance of histone PTMs on H4 and H3 in normozoospermic vs. asthenoteratozoospermic sperm samples. Dot plot comparing the relative abundance of PTMs on histones H4 and H3 between normozoospermic (NS) vs. asthenoteratozoospermic (AT) sperm samples: a) Total acetylation on H4 b) Number of acetyl groups on H4 c) H4K20 methylation d) H3K9 methylation e) H3K79 methylation f) H3K27 & K36 methylation. *p < 0.05

