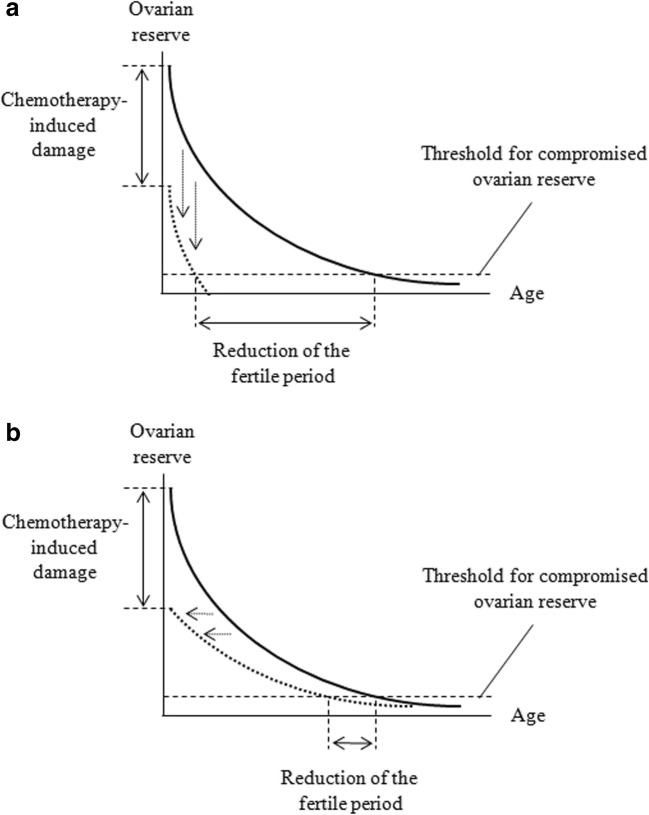
Fig. 1.
Impact of chemotherapy on ovarian reserve according to the hypothesized mathematical model guiding the loss of the primordial follicle pool. The model based on the crucial role of age is represented in the upper panel (a). The model based on the crucial role of the remnant ovarian reserve is represented in the lower panel (b). The plain curves represent the decline in ovarian reserve in basal situation (referral lines). The dotted curves represent the decline in ovarian reserve in girls exposed to chemotherapy: for simplicity, we postulated a halving of the residual ovarian reserve at the starting point. In a, the dotted curve actually corresponds to a vertical shift (downwards) of the referral curve. In b, the dotted curve actually corresponds to a lateral shift (to the left) of the referral curve. These shifts are represented with dotted arrows. The dashed horizontal lines represent the threshold of residual ovarian reserve that is required to ensure ovulatory regular cycles. Even if the notion that the decrease in ovarian reserve follows exponential rules is based on a published model [46], all the curves represented in these figures are theoretical and, therefore, no precise units are reported. However, the scales of the two axes have to be considered linear

