
Fig. 1.
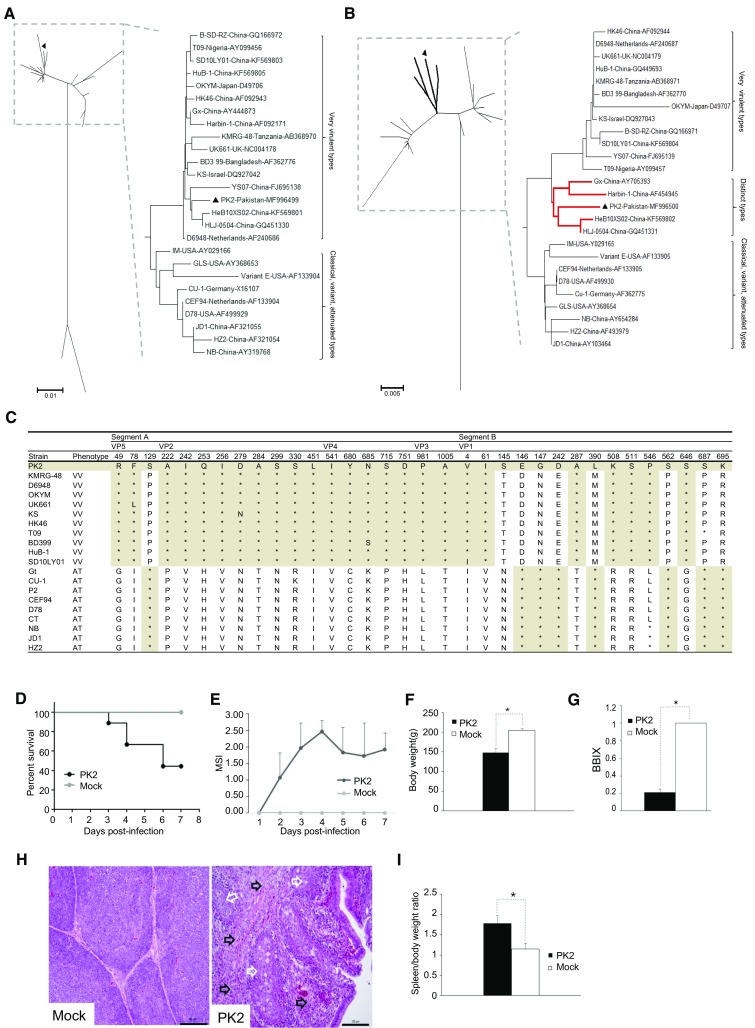
Genome analysis. Phylogenetic tree analysis of amino acid sequence of polyprotein (A) and VP1 (B). Trees were generated by the neighbor-joining method using MEGA 6 with 1000 replications. Two styles of trees were shown. The reassortant virus PK2 isolated in this study is highlighted with solid triangle. For serotype I strains, polyprotein consisted of two main branches, while VP1 were divided into three branches and the unique branch was highlighted with red bold lines. (C) Unique amino acid substitutions in VP5, polyprotein, and VP1 of vvIBDV and attenuated strains. VV, very virulent strain; AT, attenuated strain. Asterisks indicate residues identical to the sequence of PK2. (D–I) Pathogenic analyses of PK2 strain in SPF chickens. Two-week-old SPF chickens were infected with PK2 strain while the control group were inoculated with phosphate buffer solution. Chickens were monitored daily for clinical signs. At 7 days post-infection, all surviving chickens were weighted and euthanized to examine for pathological changes. (D) Survival rate. (E) The mean symptomatic index (MSI). (F) Body weight. (G) The bursa: body-weight index (BBIX) [BBIX = (bursa: body-weight ratios)/(bursa: body-weight ratios in the negative group)]. (H) Histopathological slide of bursa (hematoxylin and eosin). The histopathological bursal lesions including follicle atrophy, macrophages infiltration, lymphocytic necrosis (white arrows), and connective tissue hyperplasia (black arrows) are shown. The scale bar indicates 100 μm. (I) The spleen/body weight ratio. Average titers and standard deviations (error bars) from three independent samples are shown. The star “*” means the treatments differ significantly at a confidence level (P < 0.05).