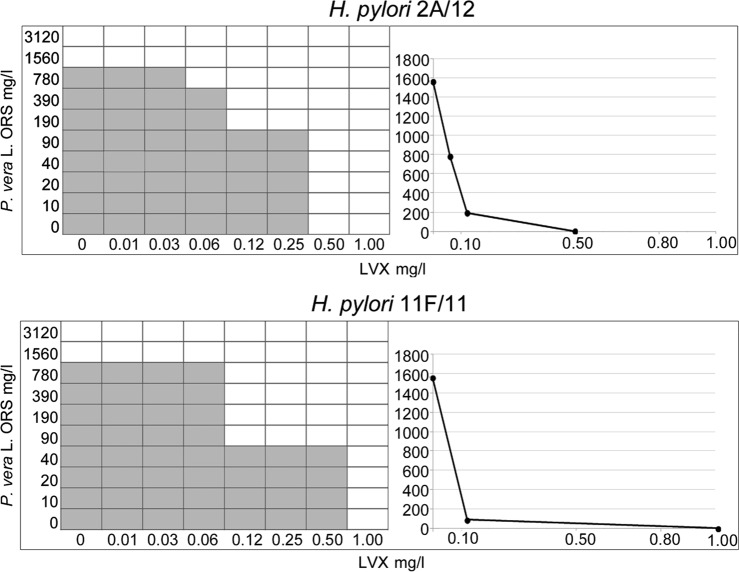
Figure 1.
Representative images of checkerboard assays and isobolograms for evaluation of synergism between P. vera L. ORS and LVX combinations against H. pylori 2A/12 and H. pylori 11F/11. The calculation of the best P. vera L. ORS and LVX combination and the Fractional Inhibitory Concentration Index (FIC I) values were interpreted as follow: synergism (FIC I ≤ 0.5), antagonism (FIC I ≥ 4.0), and additive effect (FIC I > 0.5–4.0). For H. pylori 2A/12, the MIC values are 1560 mg/l and 0.50 mg/l for P. vera L. ORS and LVX, respectively. For H. pylori 11F/11, the MIC values are 1560 mg/l and 1.00 mg/l for P. vera L. ORS and LVX, respectively. The grey zone represents the bacterial growth and the white zone represents the inhibition of bacterial growth in presence of P. vera L. ORS and LVX. The synergistic combinations of P. vera L. ORS and LVX are the white zone in which FIC I is ≤0.5. On the right, the isobolograms illustrate the result of the checkerboard assay and the FIC I values, showing the synergistic curve. The x axis of the isobologram represents the dose of LVX and the y axis represents the dose of P. vera L. ORS. The imaginary straight line connecting the intercept points represents no interaction. Between this line and the synergistic curve, there is the area of synergistic (FIC I ≤ 0.5) and additive (FIC I > 0.5–4.0) interactions. Values above of the straight line represent antagonistic interactions (FIC I ≥ 4.0).

