Figure 3.
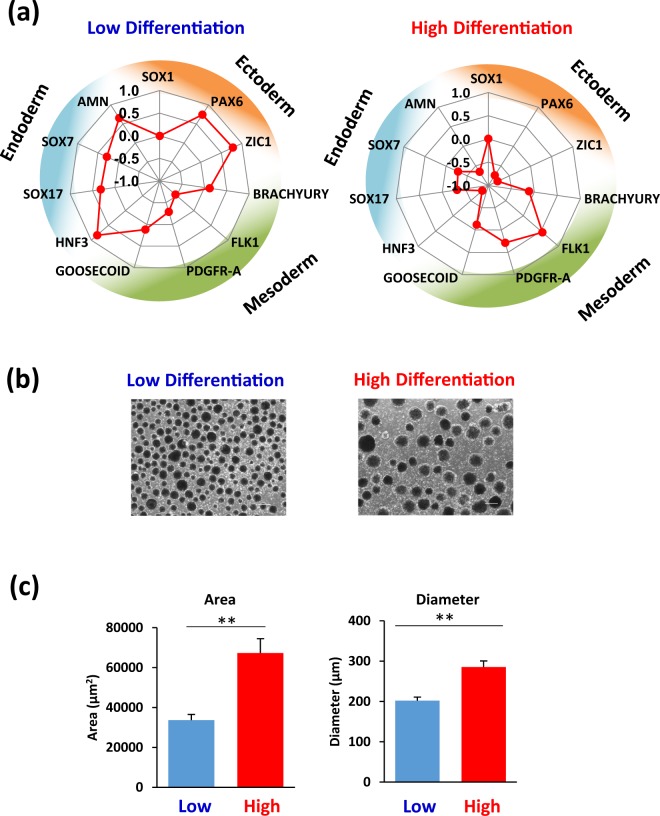
Comparison of differentiation direction of hiPSC lines at 4 d post-cardiac differentiation. (a) Radar chart based on expression levels of endoderm, ectoderm, and mesoderm-related genes at 4 d post-cardiac differentiation. (b) Images of EBs 6 d post-cardiac differentiation of the training set of hiPSC lines. Scale bars = 300 μm. (c) Cross-sectional area and diameter of EBs at 6 d post-cardiac differentiation. Data are expressed as mean ± SEM (n = 6). **p < 0.01, t-test.

