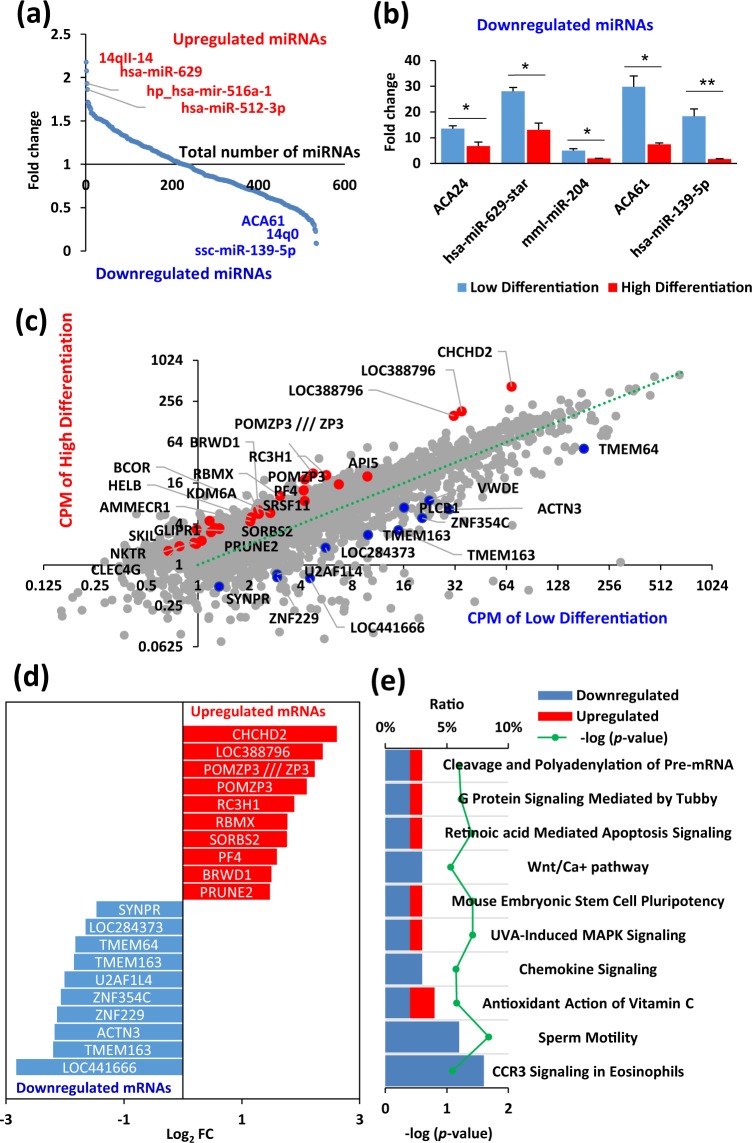
Figure 4.
Transcriptome analysis of undifferentiated hiPSCs using miRNA array and GeneChip array. (a) Plot showing expression of relative fold change expression between high and low differentiation groups. The x-axis indicates miRNA ranks for relative fold change and the y-axis shows the expression ratio (high/low) based on the differential profiles of 535 miRNAs in hiPSCs. (b) The differential expression of miRNAs in the high differentiation and low differentiation groups at a p < 0.05 and FC > 2. Data are expressed as mean ± SEM (n = 3). **p < 0.01; *p < 0.05, t-test. (c) Scatter plot showing counts per million (CPM) of high differentiation (y-axis) vs. CPM of low differentiation (x-axis) from the mRNA array analysis. Red and blue coloured points and gene names indicate mRNAs that were significantly changed (FC > 2 and p < 0.01, t-test). (d) Graph showing the fold changes of the top and bottom differentially expressed genes from a GeneChip analysis comparing the high differentiation group with the low differentiation group. Selected genes have been colour-coded and labelled. Red, top 10 expression in the high differentiation group (p < 0.01, t-test); blue, top 10 expression in the low differentiation group (p < 0.01). (e) Pathway analysis of the collective expression levels of interacting genes involved in specific pathways.

