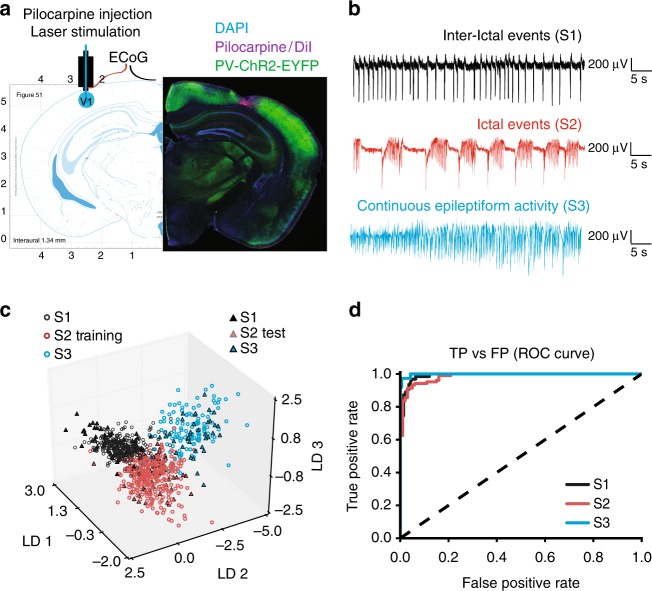
Fig. 1.
Acute epileptiform activity induced by pilocarpine injections in the mouse visual cortex. a Left: diagram showing the cannula guide location over the site of pilocarpine injection, ElectroCorticoGram (ECoG) recording and photostimulation in the visual cortex V1 area. Right: immunofluorescence of PV+ interneurons expressing ChR2-EYFP (green), cell nuclei staining DAPI (blue) and DiI co-injected with pilocarpine (magenta). Restricted DiI spread suggests that pilocarpine has a local action. b ECoG traces showing three different types of epileptiform activity induced by pilocarpine (States 1, 2, 3). c 3D plot of the linear discriminant analysis demonstrates network state separation on the training (open circles) and test (filled triangles) ECoG samples. Each linear discriminant (LD1, LD2, LD3) corresponds to a particular combination of weights of the 20 features extracted from ECoG traces. d Performance of the random forest network state classifier expressed as a Receiver Operating Characteristic (ROC) curve. TP true positives, FP false positives. The dashed line shows random allocation of events. Source data are provided as a Source Data file

