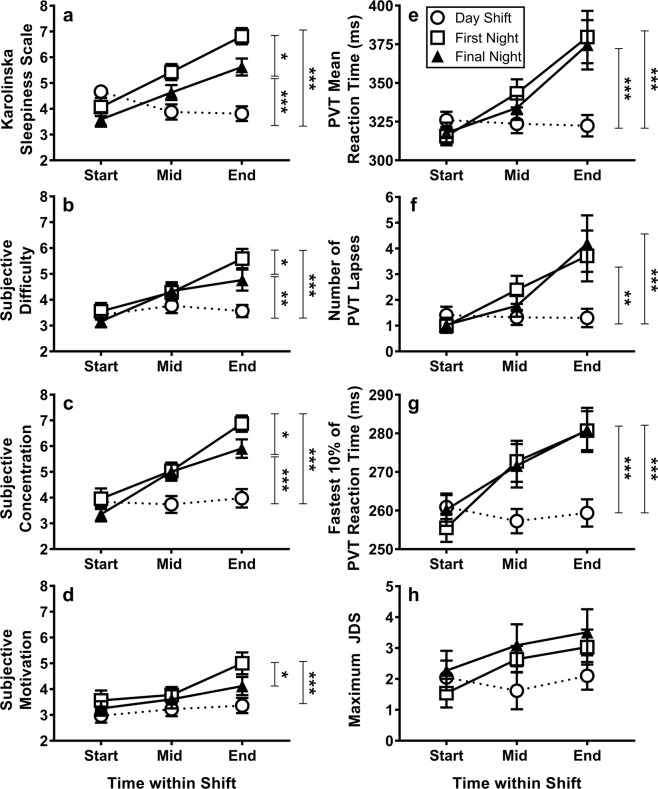
Figure 3.
Alertness, performance and subjective report for PVT performance of intensive care workers on a day shift and first and final (3rd/4th/5th) night shift as measured by (a) Karolinska Sleepiness Scale, (b) subjective difficulty, (c) subjective concentration, (d) subjective motivation, (e) PVT mean reaction time (f) number of PVT lapses (g) PVT fastest 10% of reaction times and (h) maximum JDS (n = 9) during the 5-minute PVT. In all figures, higher values represent poorer outcomes. Higher values indicate increased impairment on all measures. Astericks indicate differences between shifts only at the end of shifts *p ≤ 0.05, **p ≤ 0.005, and ***p ≤ 0.001 indicates the differences in alertness and performance at the end of shifts between day and first night, day and final night and between first and final night shift.

