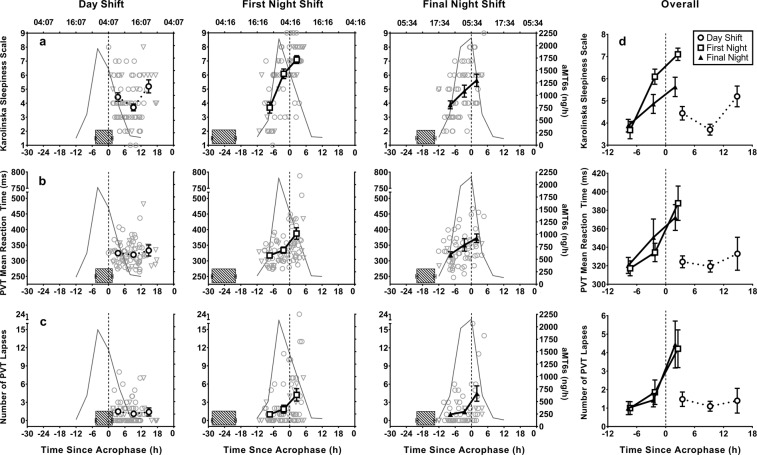
Figure 4.
Alertness and performance of intensive care workers relative to aMT6s acrophase on a day (left), first (middle) and final (3rd–5th) night shift (right) shown by the (a) Karolinska Sleepiness Scale, (b) PVT mean reaction time, (c) number of PVT lapses. Zero on the x-axis indicates time of acrophase, positive values represent tests before acrophase (day shift: 0–6 h, 6–12 h, 12–18 h; night shift: −12 to −5 h, −5–0 h, 0–5 h) Grey curves represent aMT6s rhythms averaged for all individuals. Striped horizontal bars represent the average main sleep prior to the start of a shift. Right panel (d) presents combined graphs of the changes in KSS, PVT mean reaction time and PVT lapses across the day, first and final night shift.

